

Doherty Smith & Associates is now Compass Consulting Surveyors
Click here to see this blog and more on our new website compasscs.com.au
Geomorphic Assessment
Macquarie River, Montefiores
Geomorphology is a study of how land changes over time. Fluvial Geomorphology is a study of how watercourses change over time. This blog details work undertaken by Doherty Smith & Associates Consulting Surveyors in preparing a Geomorphic Assessment of a stretch of the Macquarie River at Montefiores (Wellington), NSW.
In 2013, Doherty Smith & Associates were engaged by a land owner in Montefiores (Wellington), NSW to prepare a survey identifying the location of a building on the land in relation to the boundaries. The site is located on the northern bank of the Macquarie River, about 600 metres west of the current junction of the Macquarie River with the Bell River.
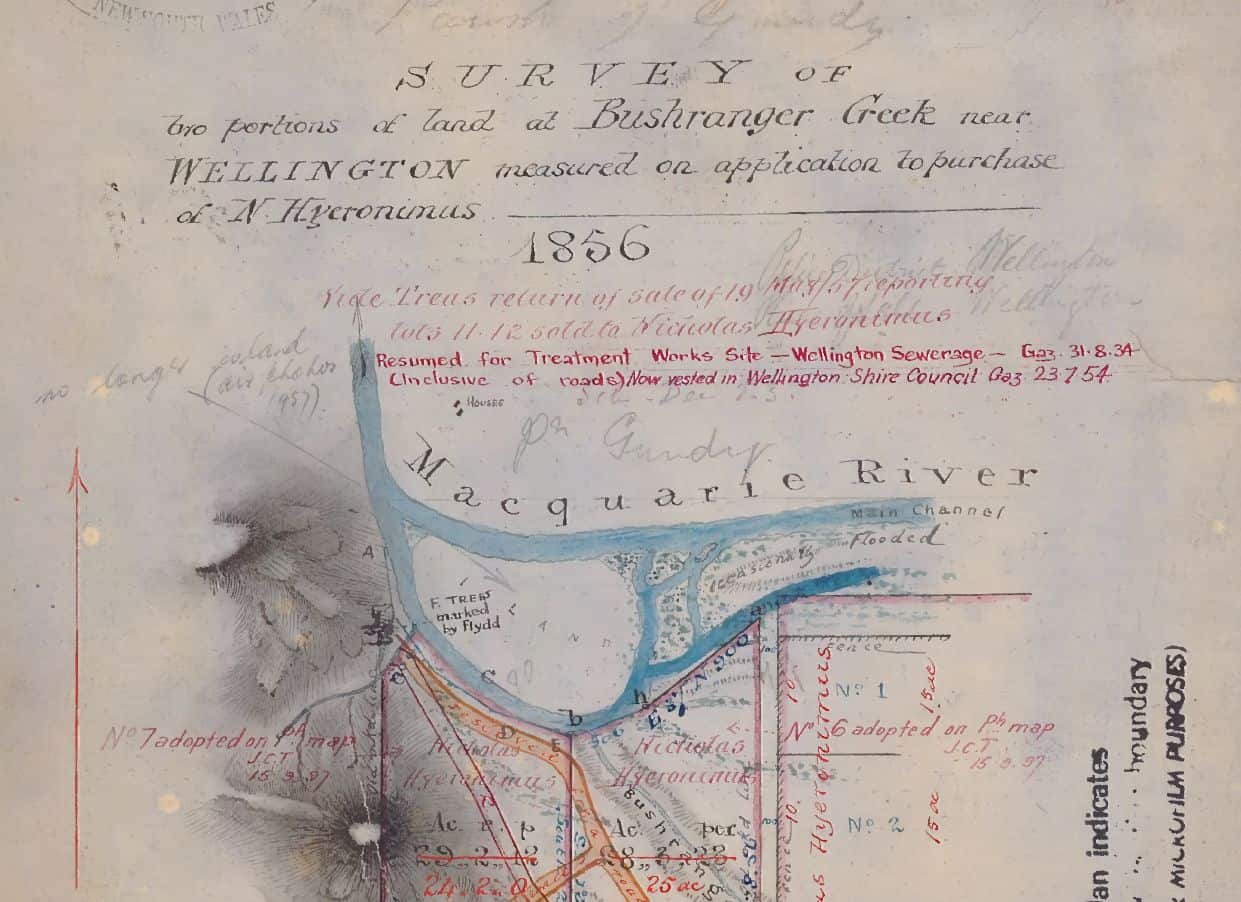
The land initially investigated is shown in plan 4-1566 dated 1856:
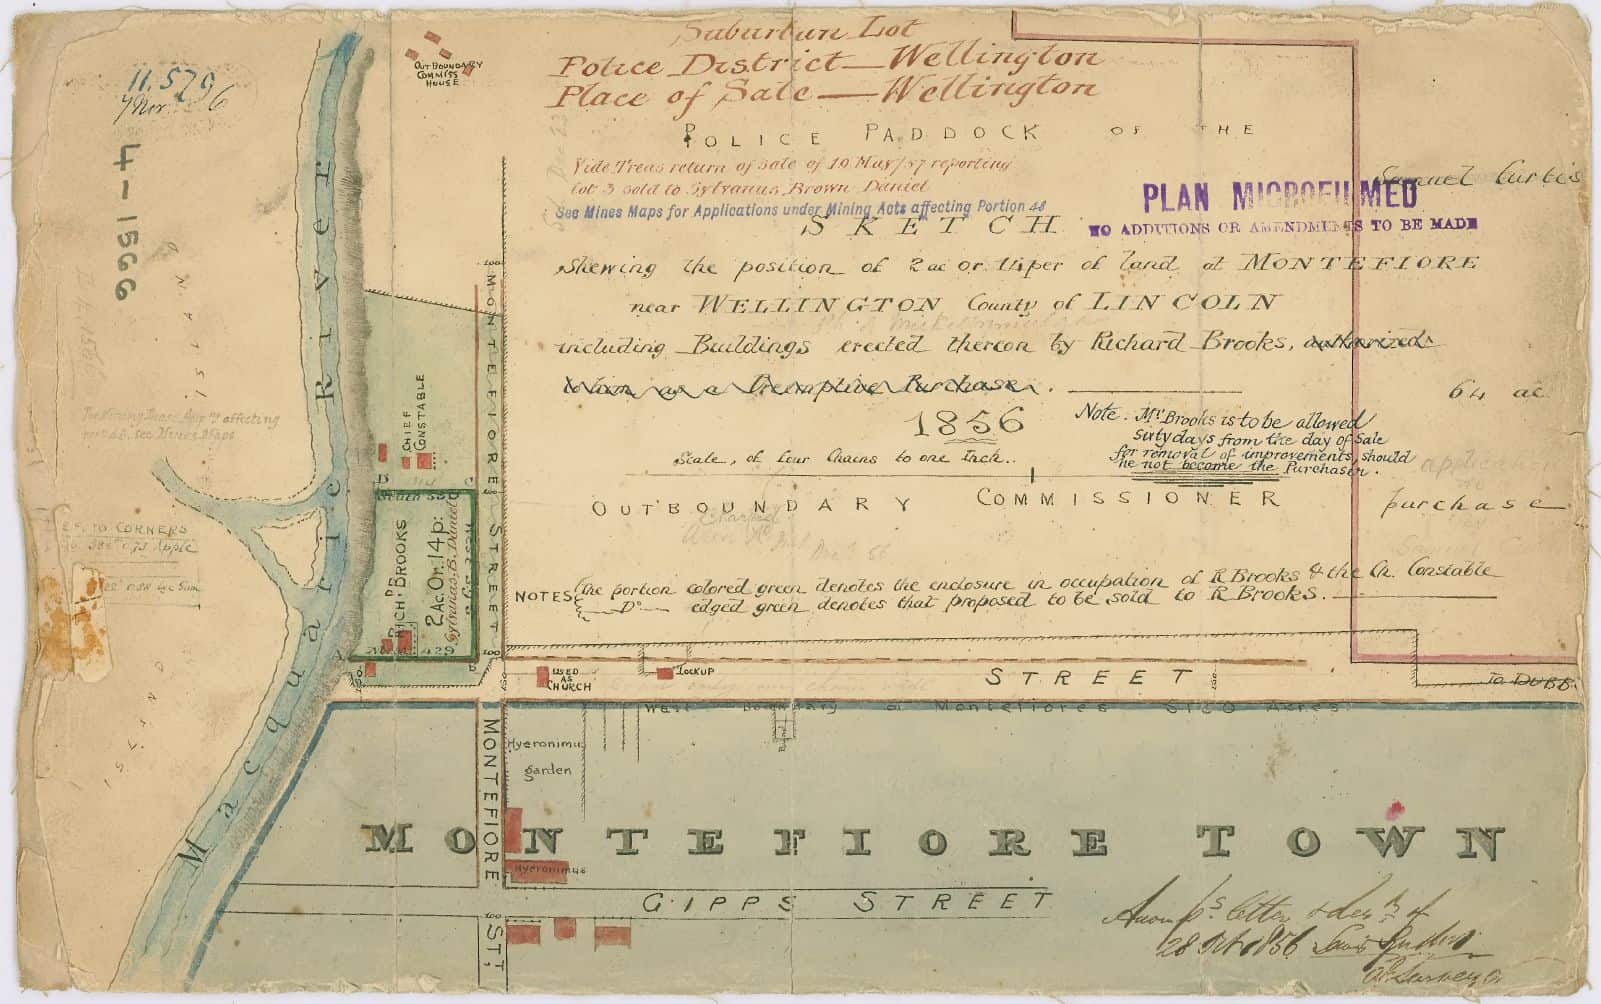
Plan 4-1566 dated 1856
The survey determined that the dwelling on Lot 48 encroaches upon the adjacent road reserve, and steps were taken to start the road closure process to resolve this encroachment. The survey also found that the river bank had changed significantly since 1856.
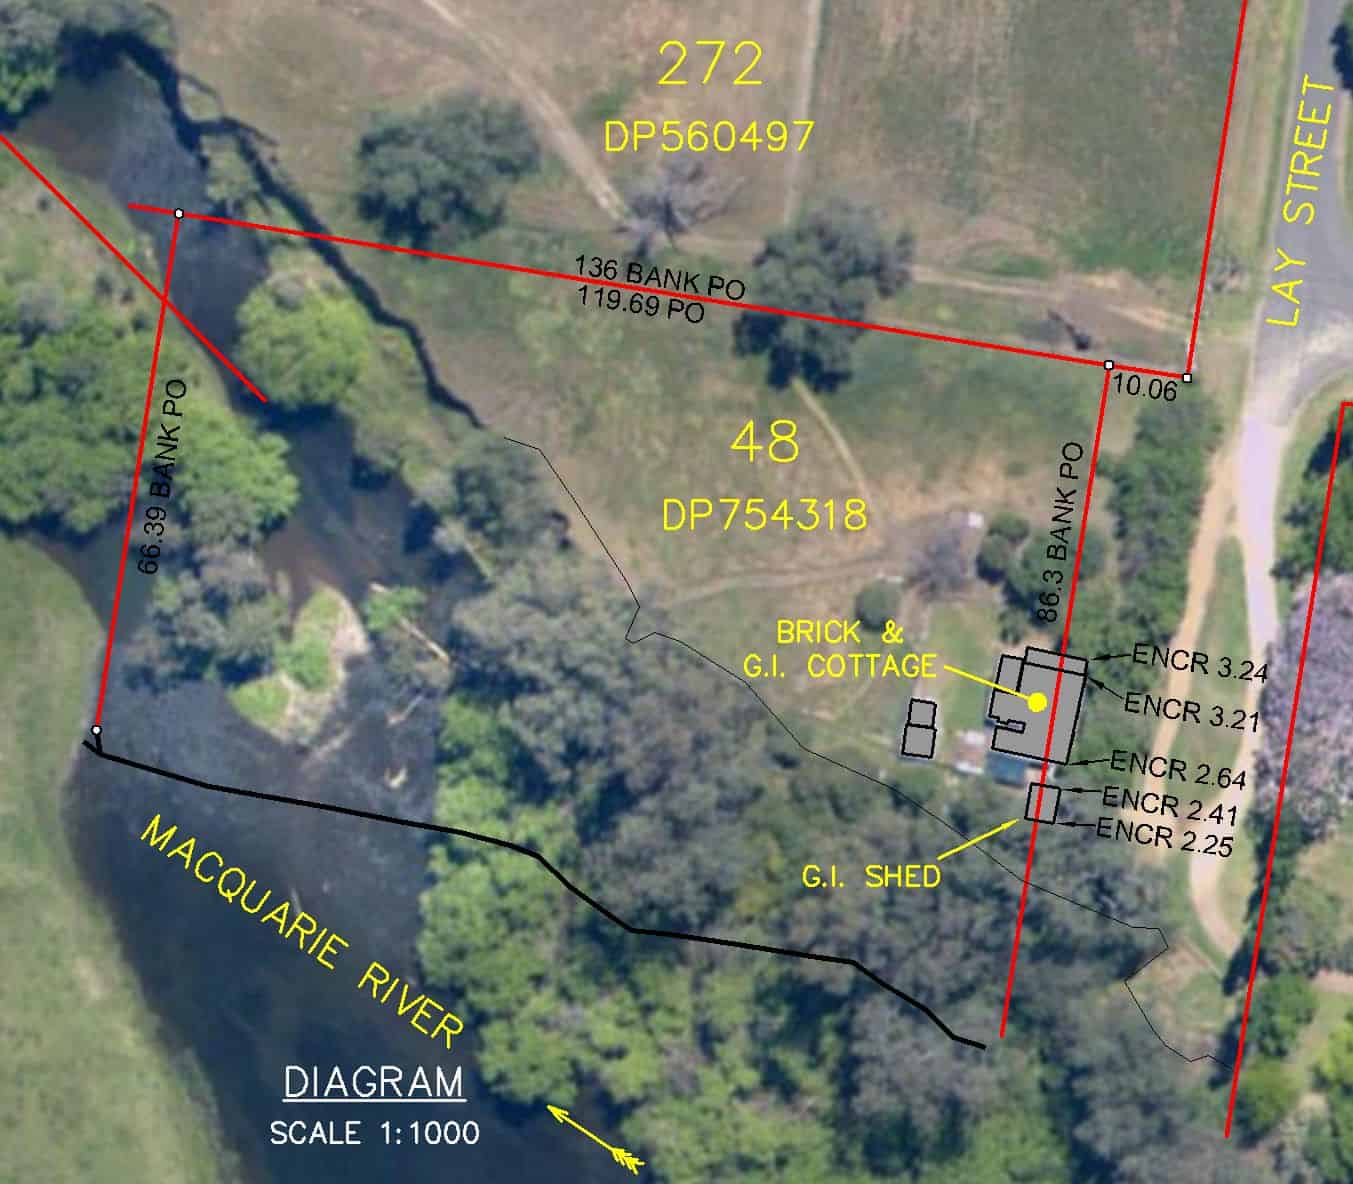
Initial survey shows large discrepancy with river bank location.
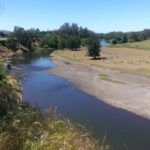
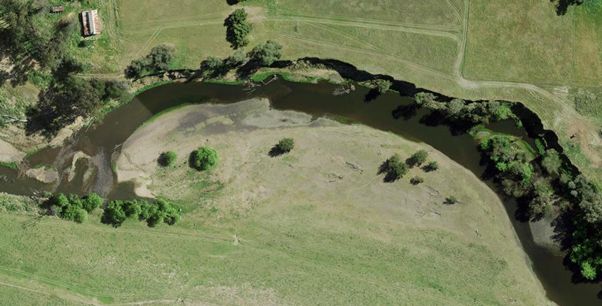
The survey did not specifically relate to the river bank at the early stages, however based on aerial imagery it was clear that about half the area of the original land has been lost to erosion. The river bank in this area is currently quite stable, thickly vegetated with established gum trees and woody weeds.
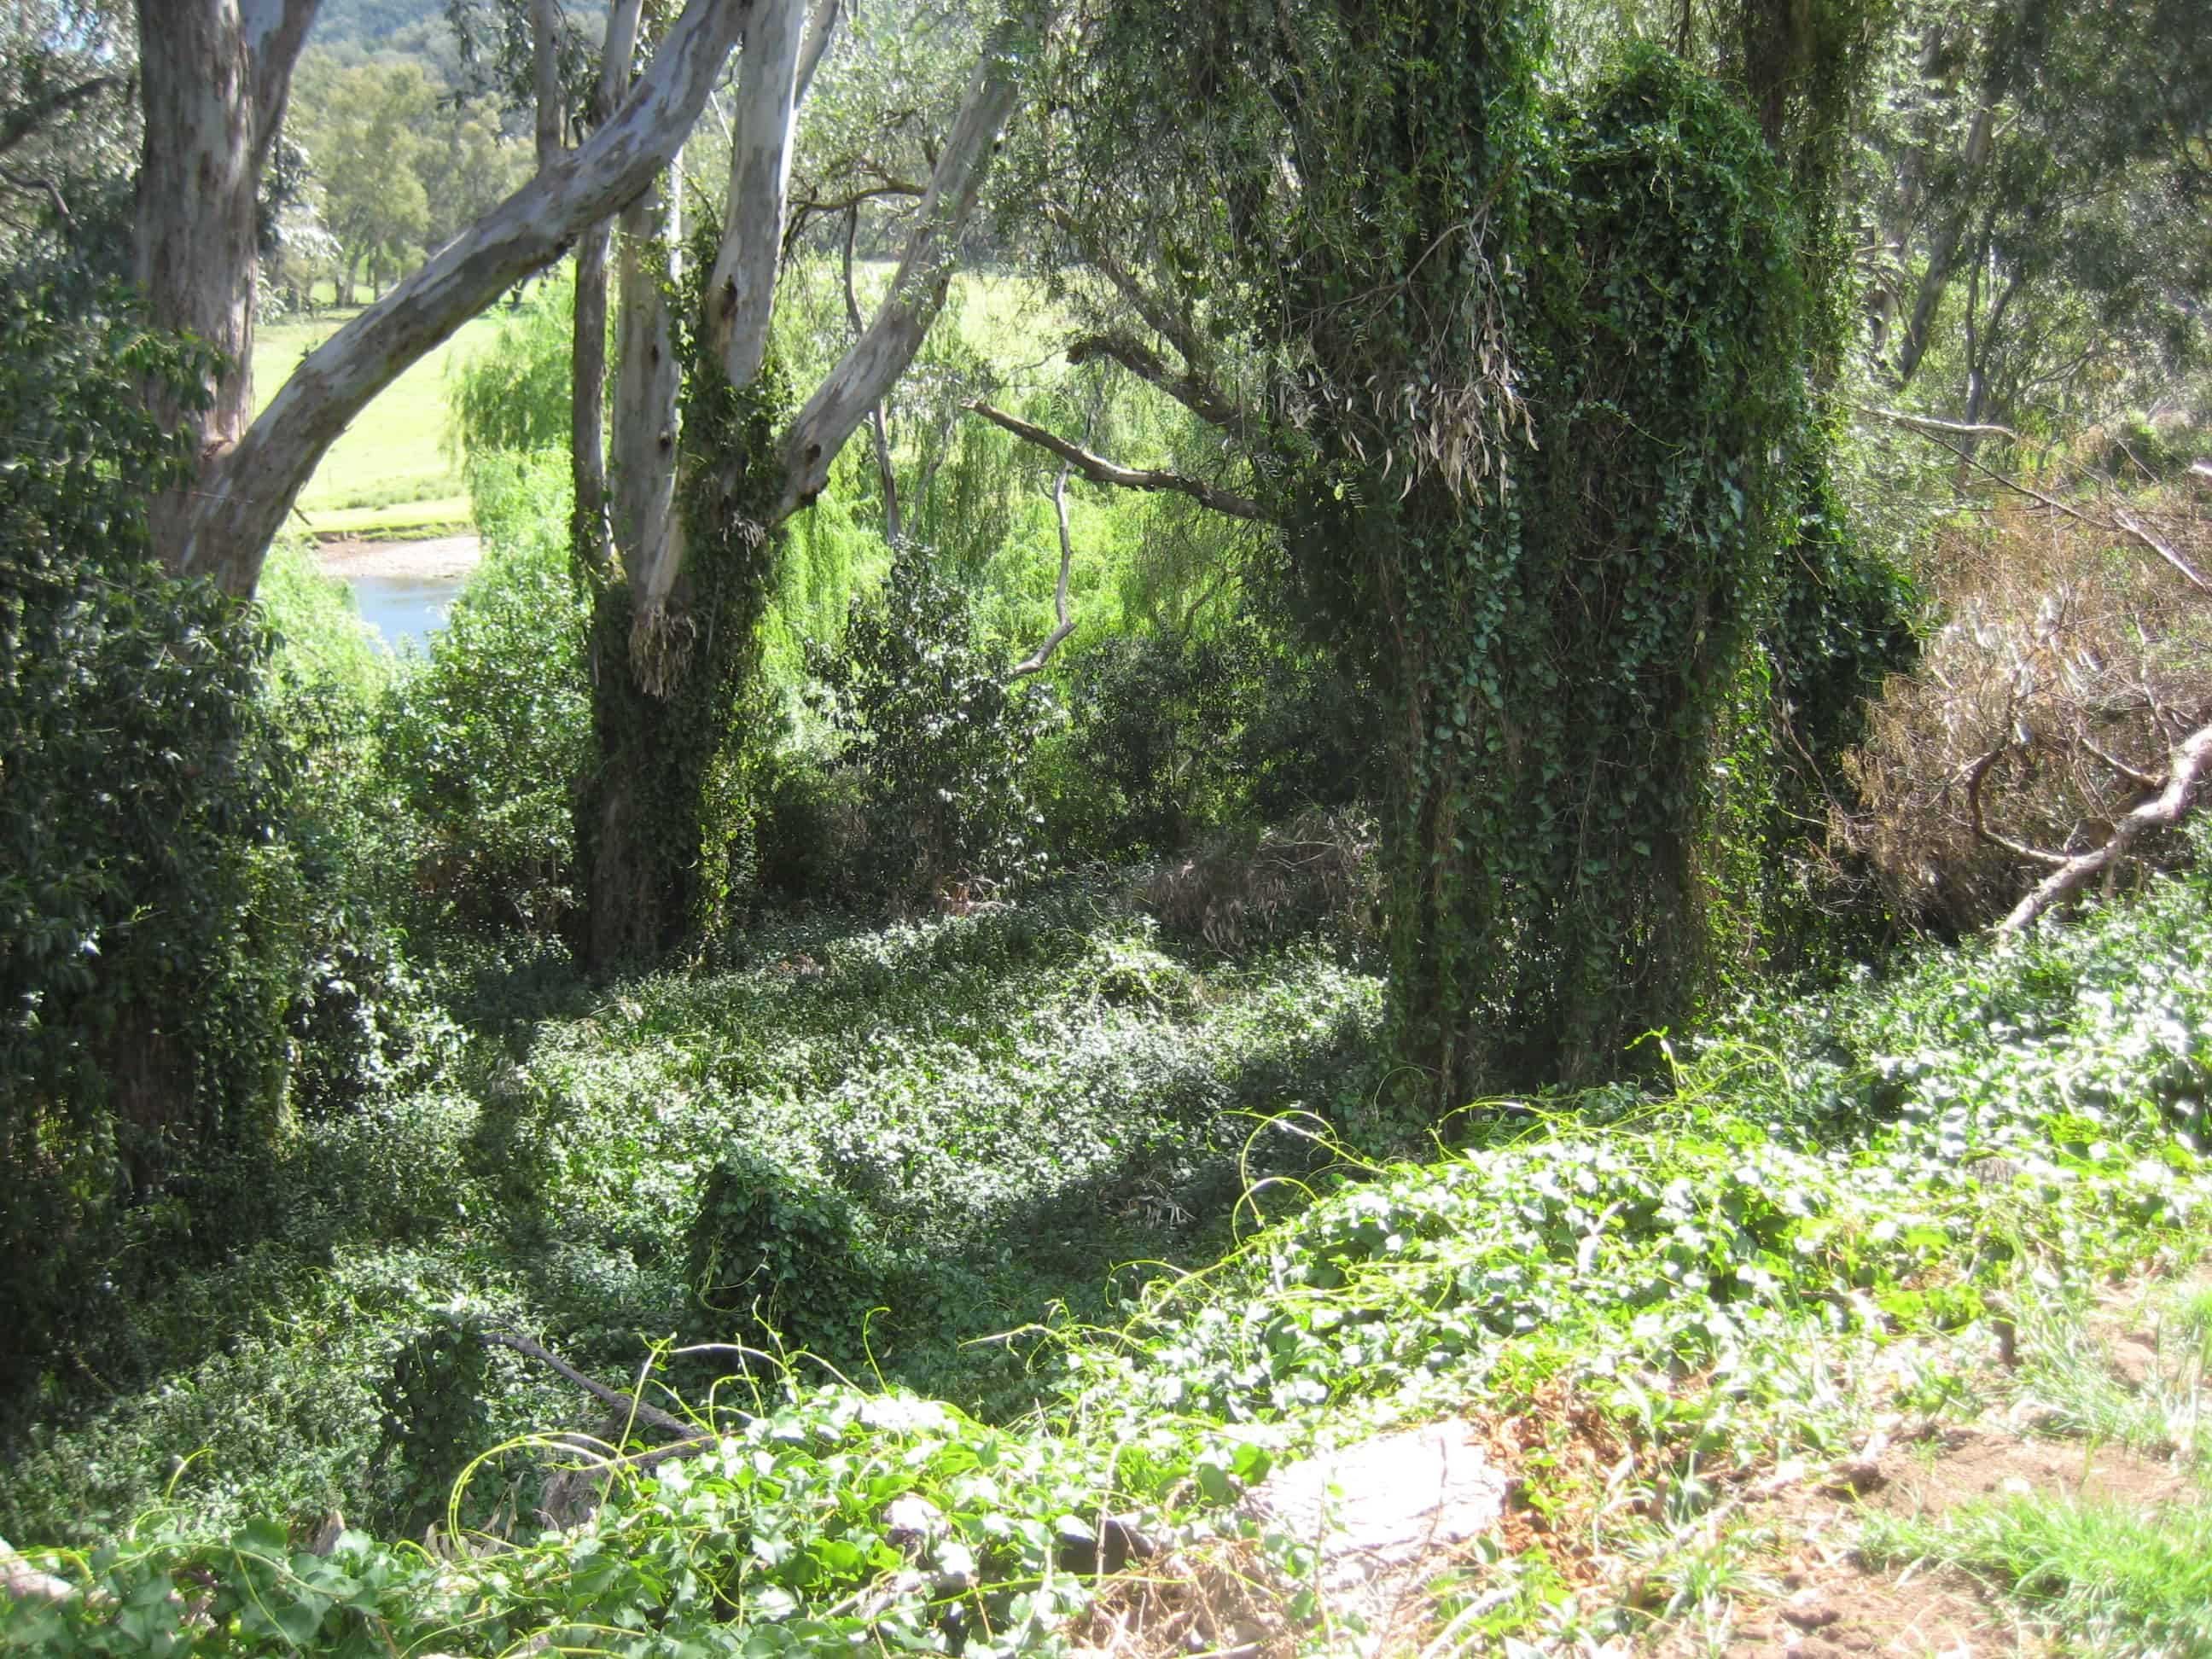
Macquarie River bank near dwelling.
The erosion was discussed with the land owner, who was aware of the erosion and pointed out his concerns with the changes to the river to the west of the initial survey site.
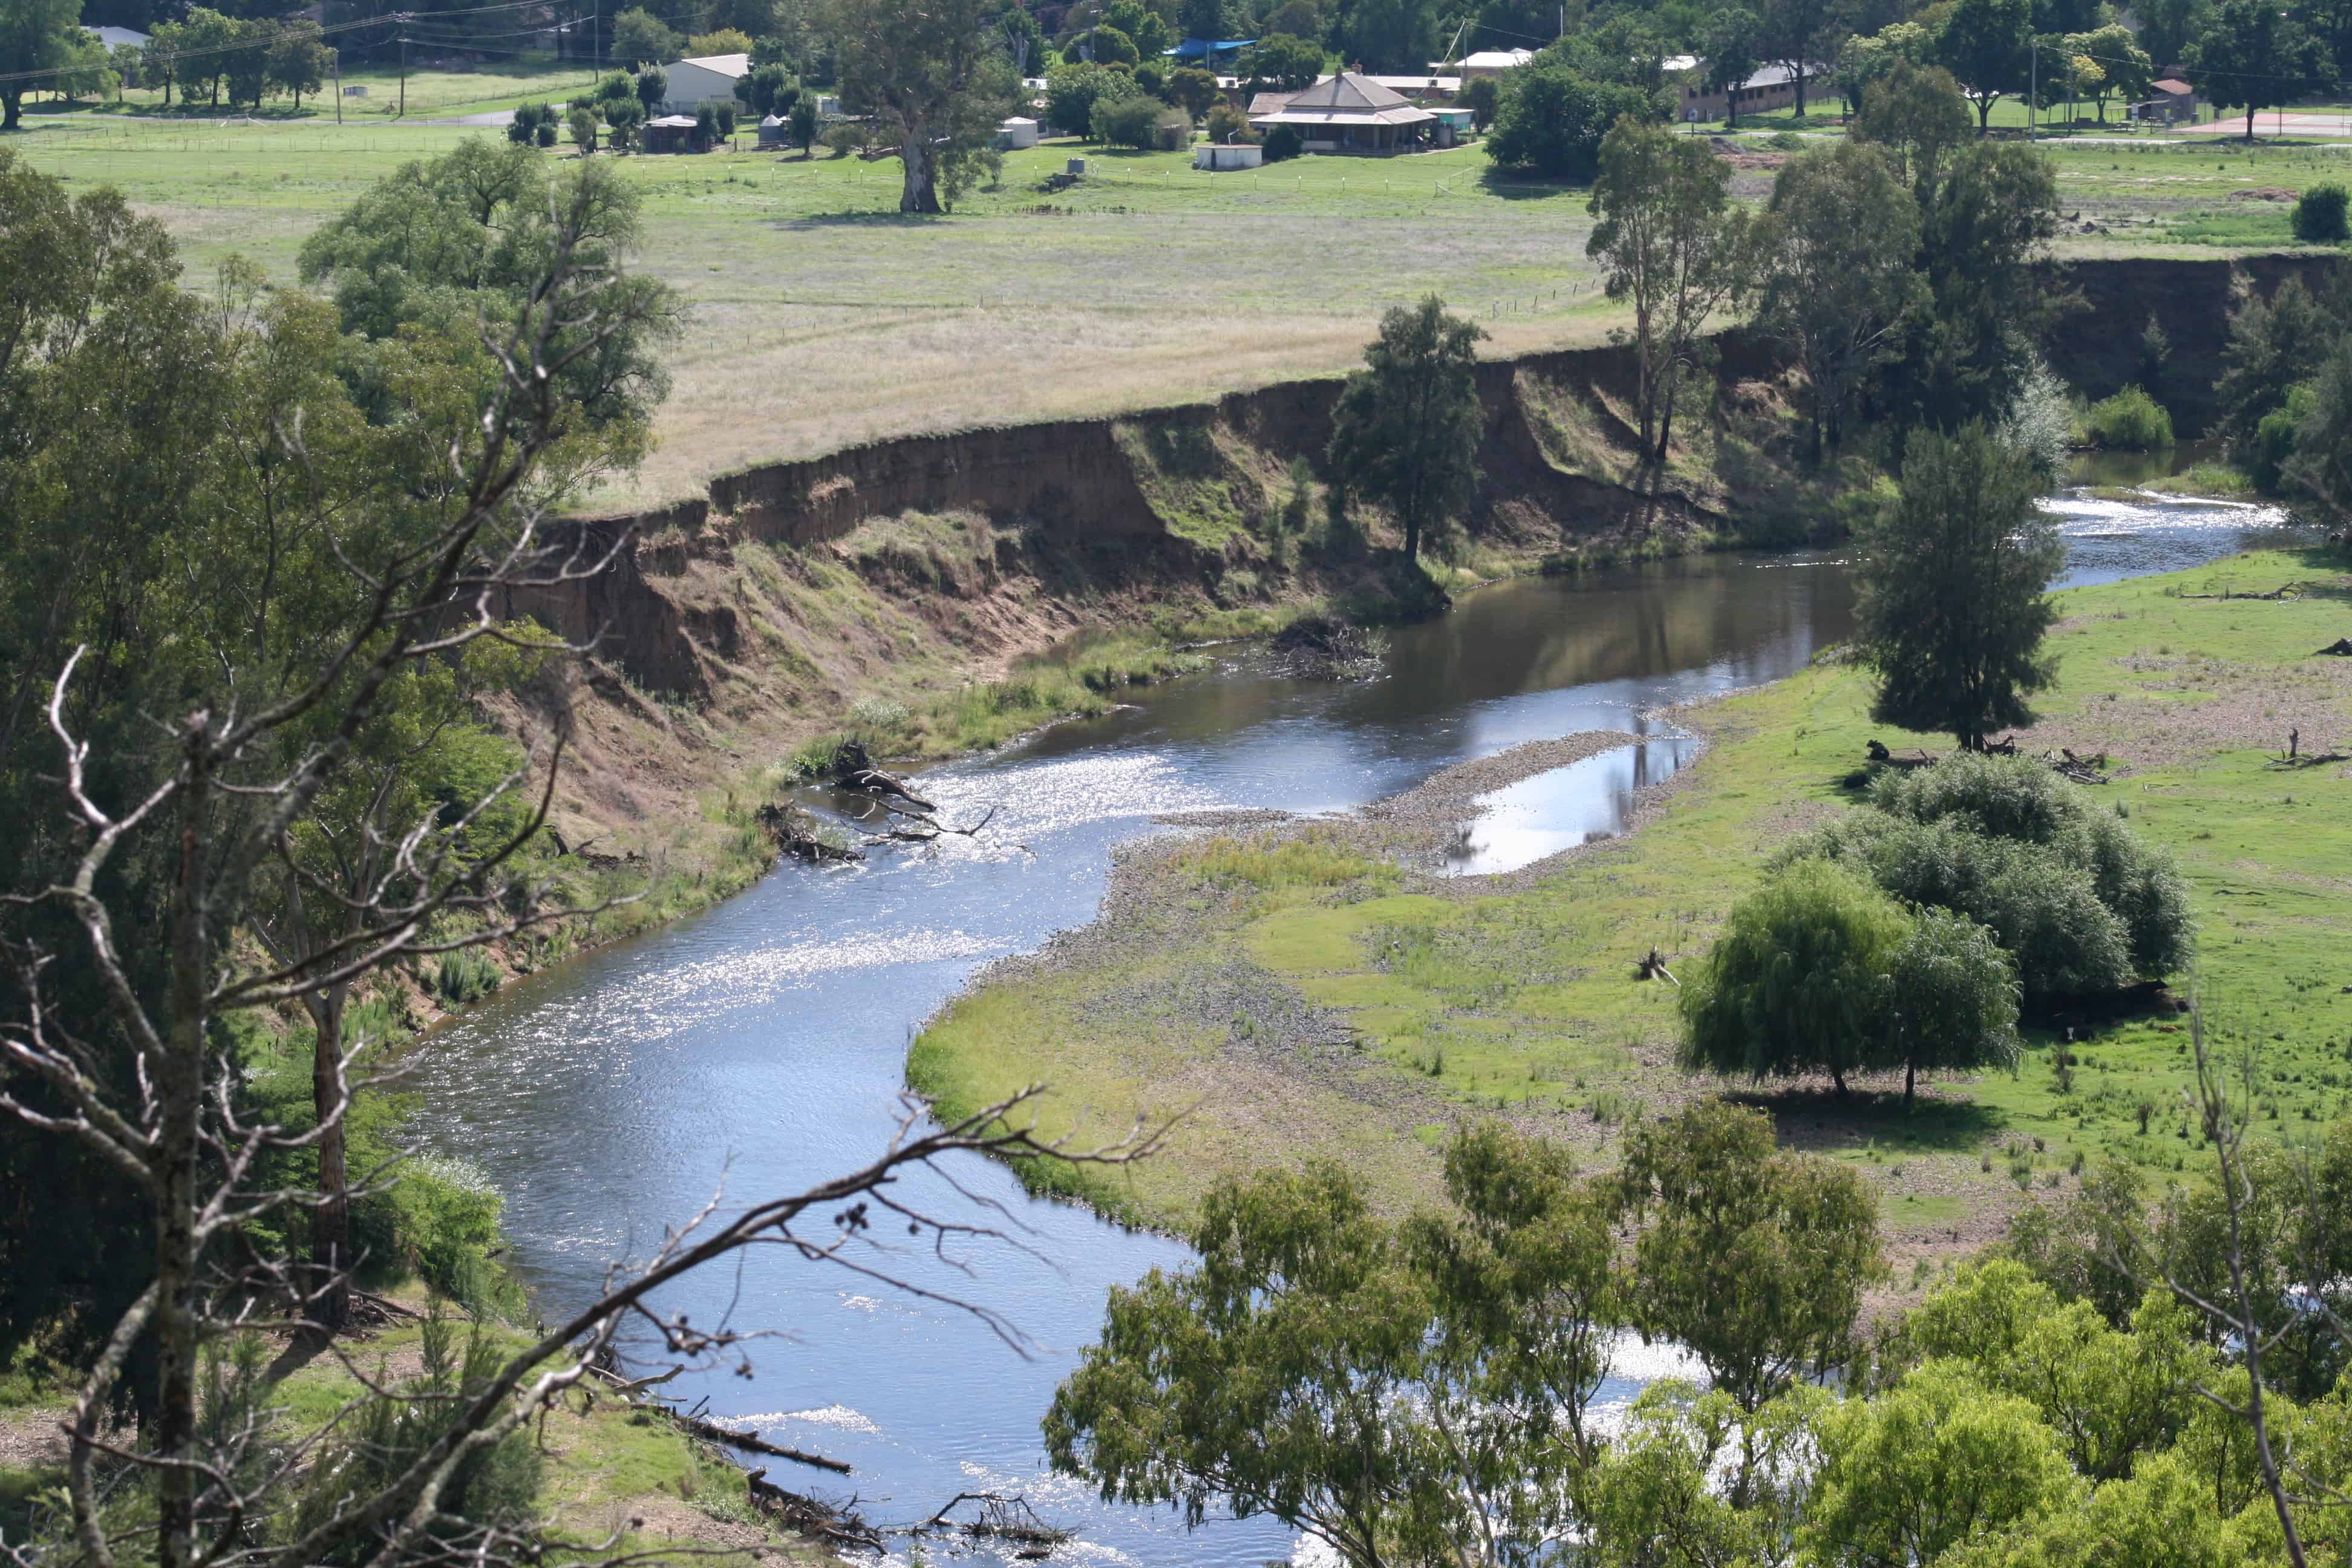
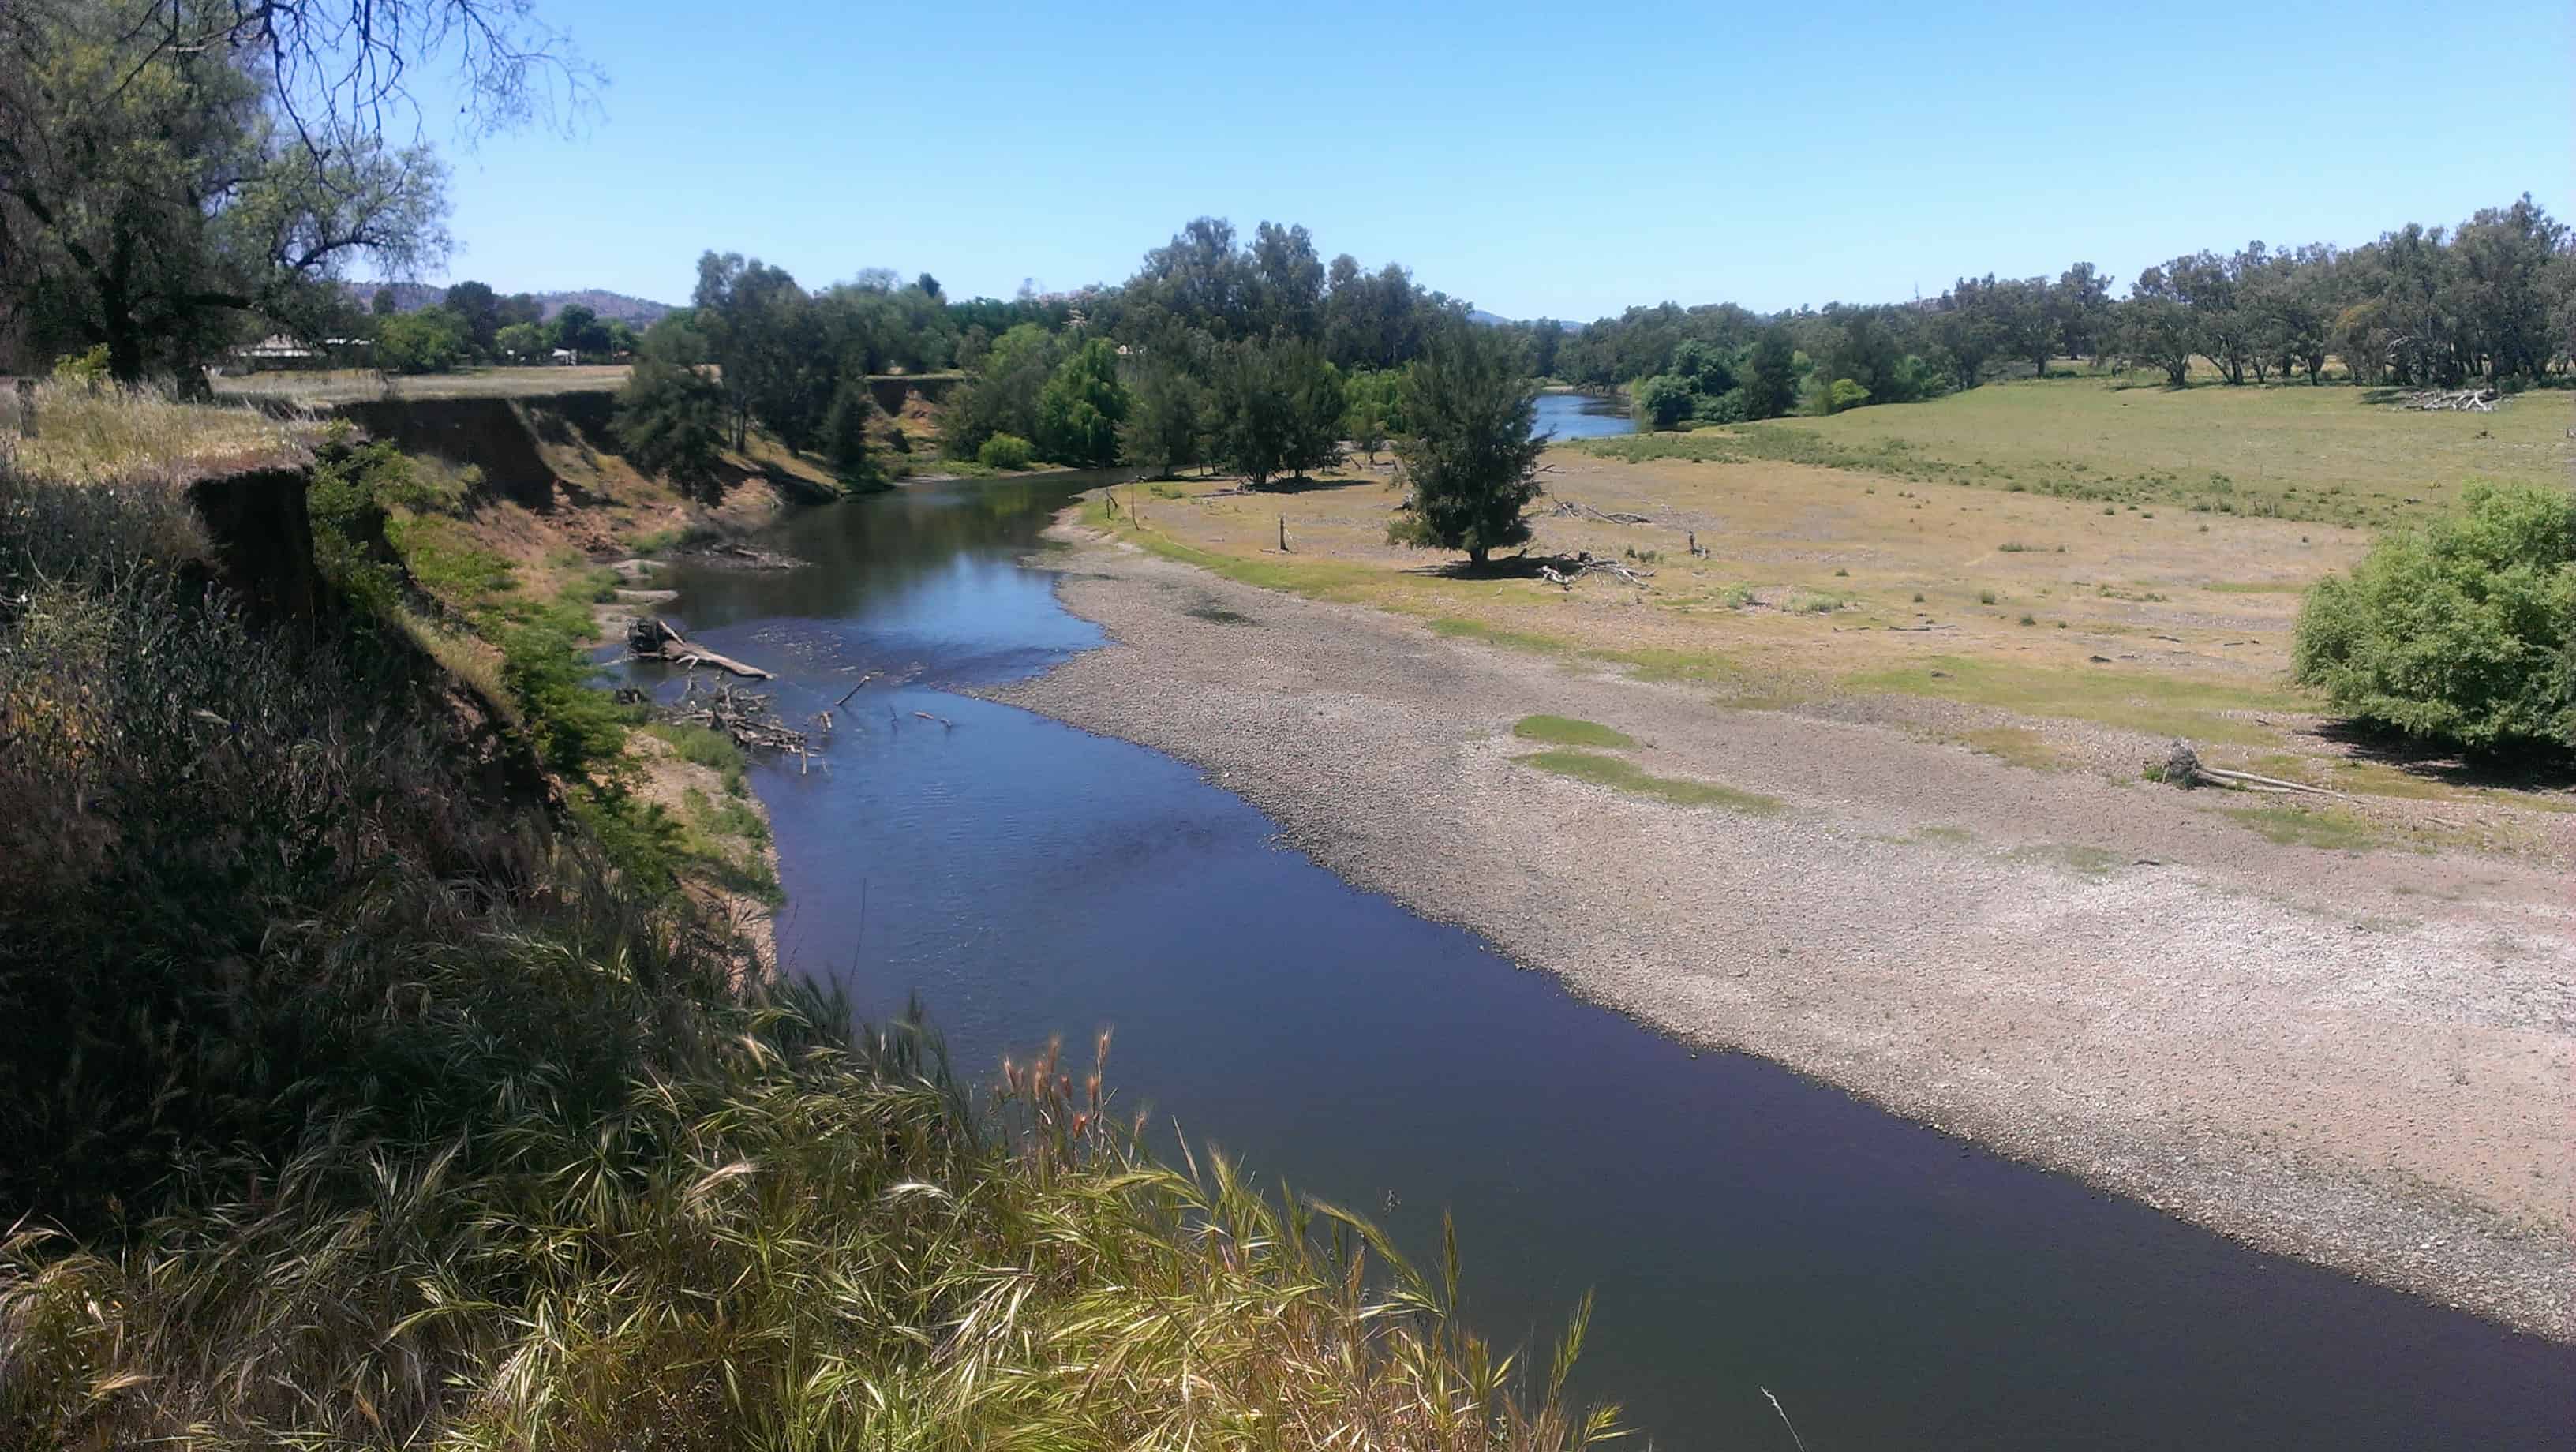
Erosion site, located west of dwelling and initial survey site.
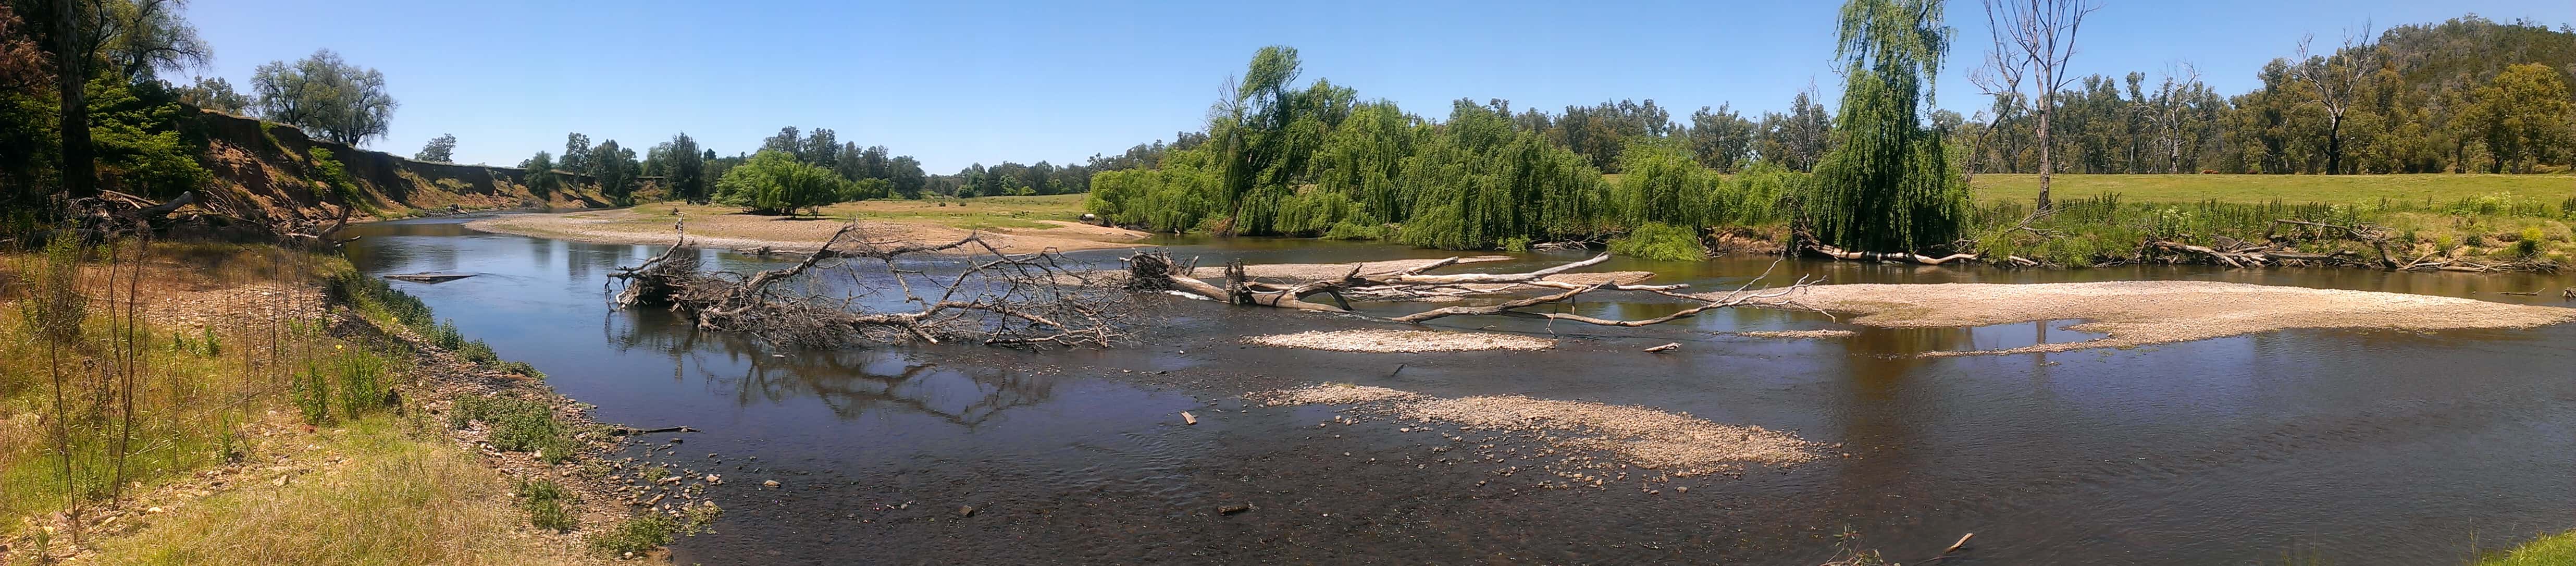
The river bank material is a highly erodible soil type, consisting of a loose gravel sub-base with an upper layer of stratified unconsolidated sands and unstable silt which slakes very quickly when immersed in water. Large blocks of the bank fall from the top of the 12 metre high bank, particularly after a flood event when the upper layer is saturated. Crack appear up to 2 metres from the edge of the bank when a block is formed. This is unstable and extremely dangerous.
At the time of the initial survey, the land owner was in the process of obtaining grants and approvals to rehabilitate the river bank. This involved multiple state and local government agencies including:
- Wellington Council
- State Water NSW
- Fisheries NSW
- Office of Water NSW
- EPA NSW
- Department of Primary Industries NSW
- Soil Conservation Service
- Central West Local Land Services
- Land and Property Information NSW
- Landcare
The land owner asked for our assistance in dealing with the agencies and for advice in relation to how to monitor the site for changes. There was a limited budget for this work and much of our time has been performed on a volunteer basis for no charge.
The erosion caused a house to be lost in the years prior to 1955:
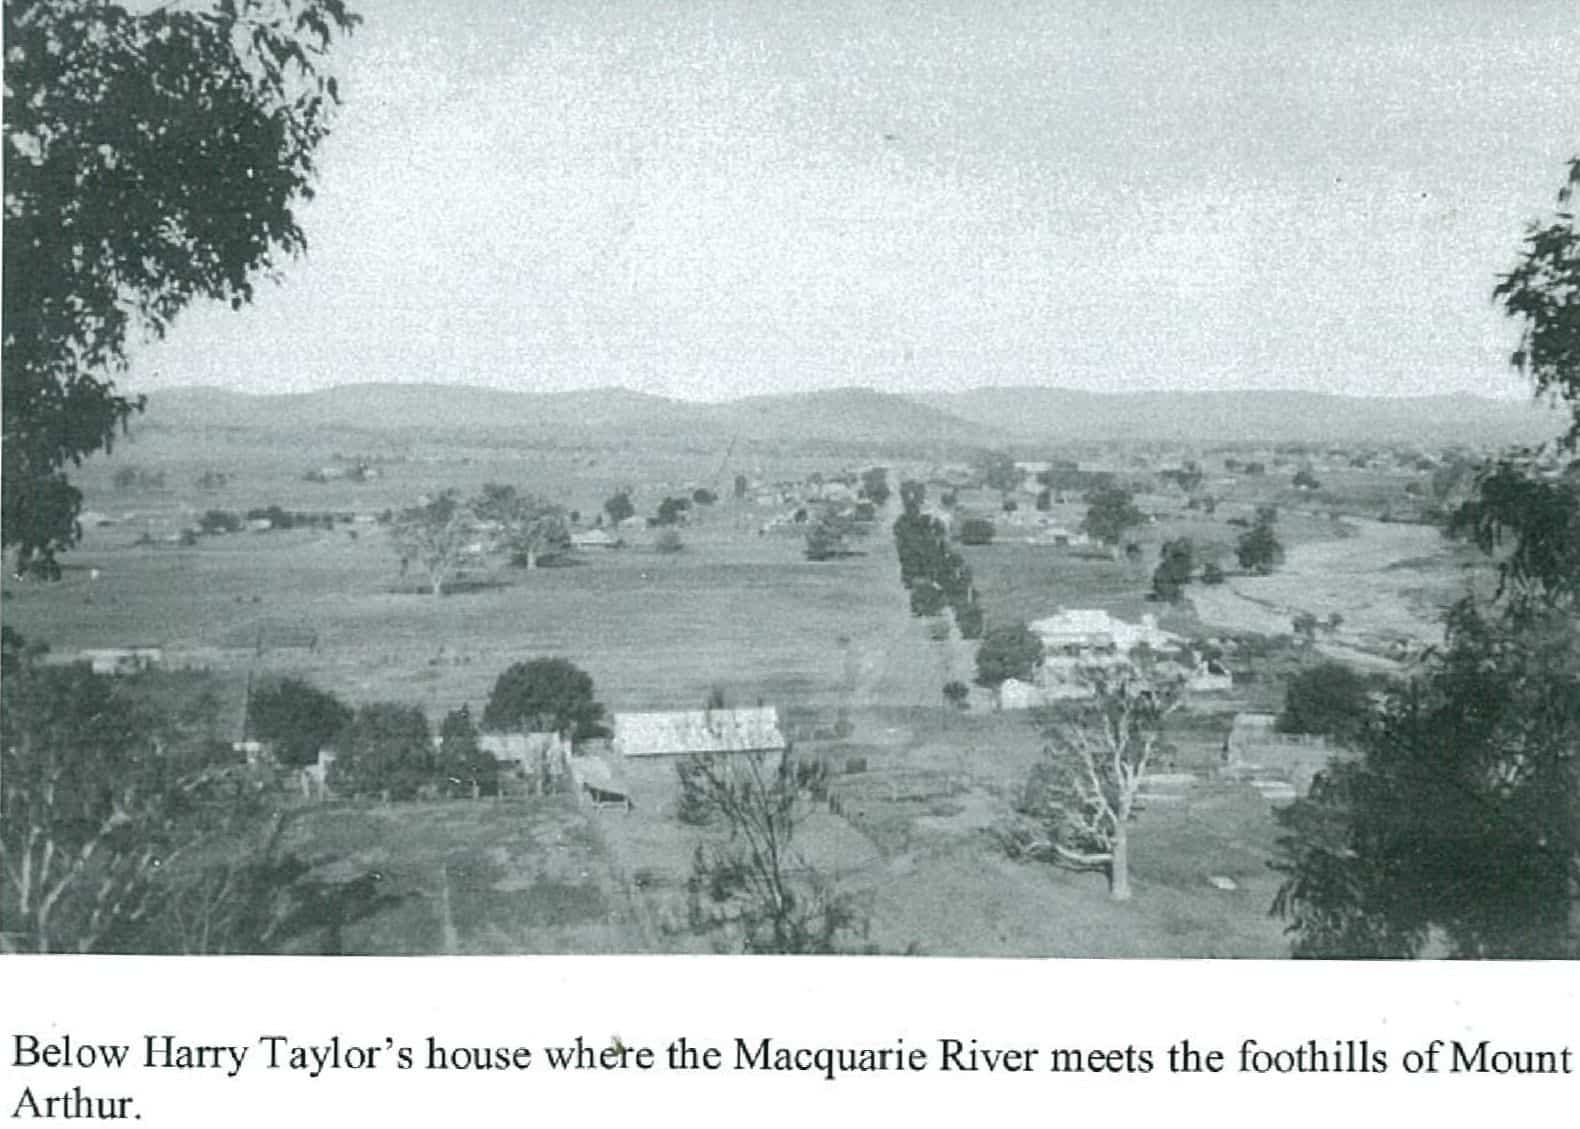
View of site taken from the hills overlooking from the west. House is now gone.
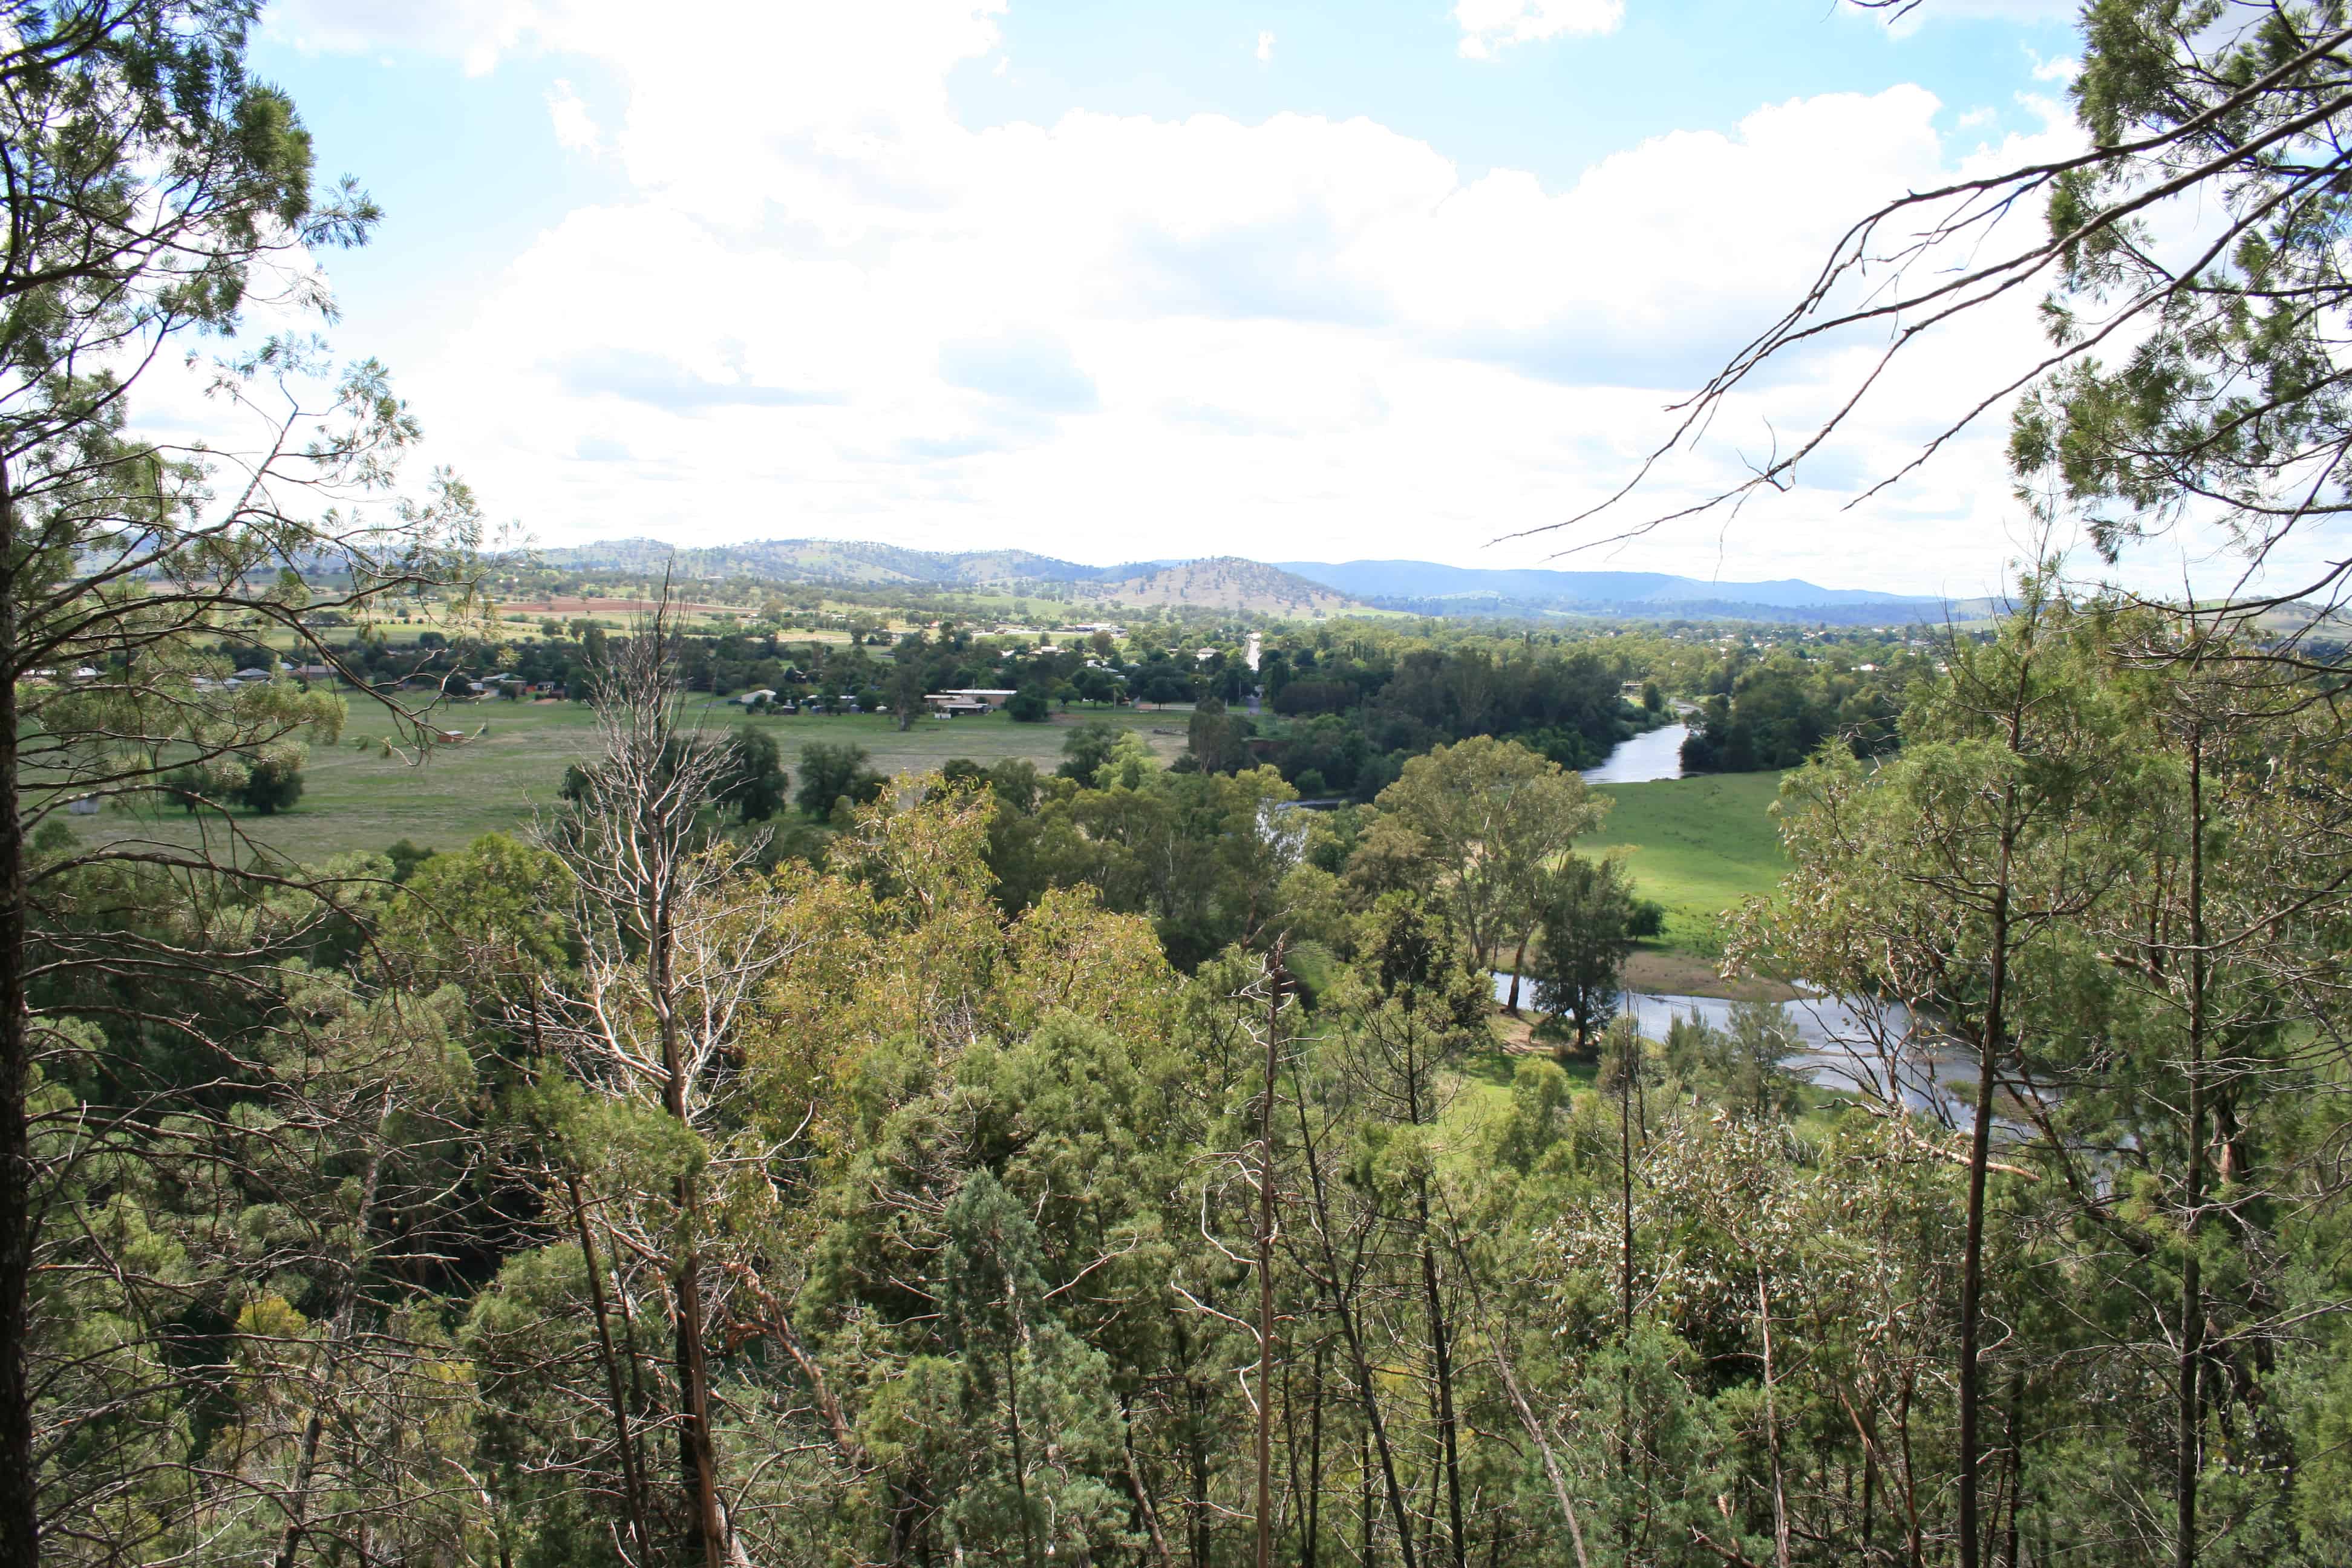
View from hills to the west of the site, indicating that the house shown in previous image is gone.
The old brick well from the house now lies in the river bed.
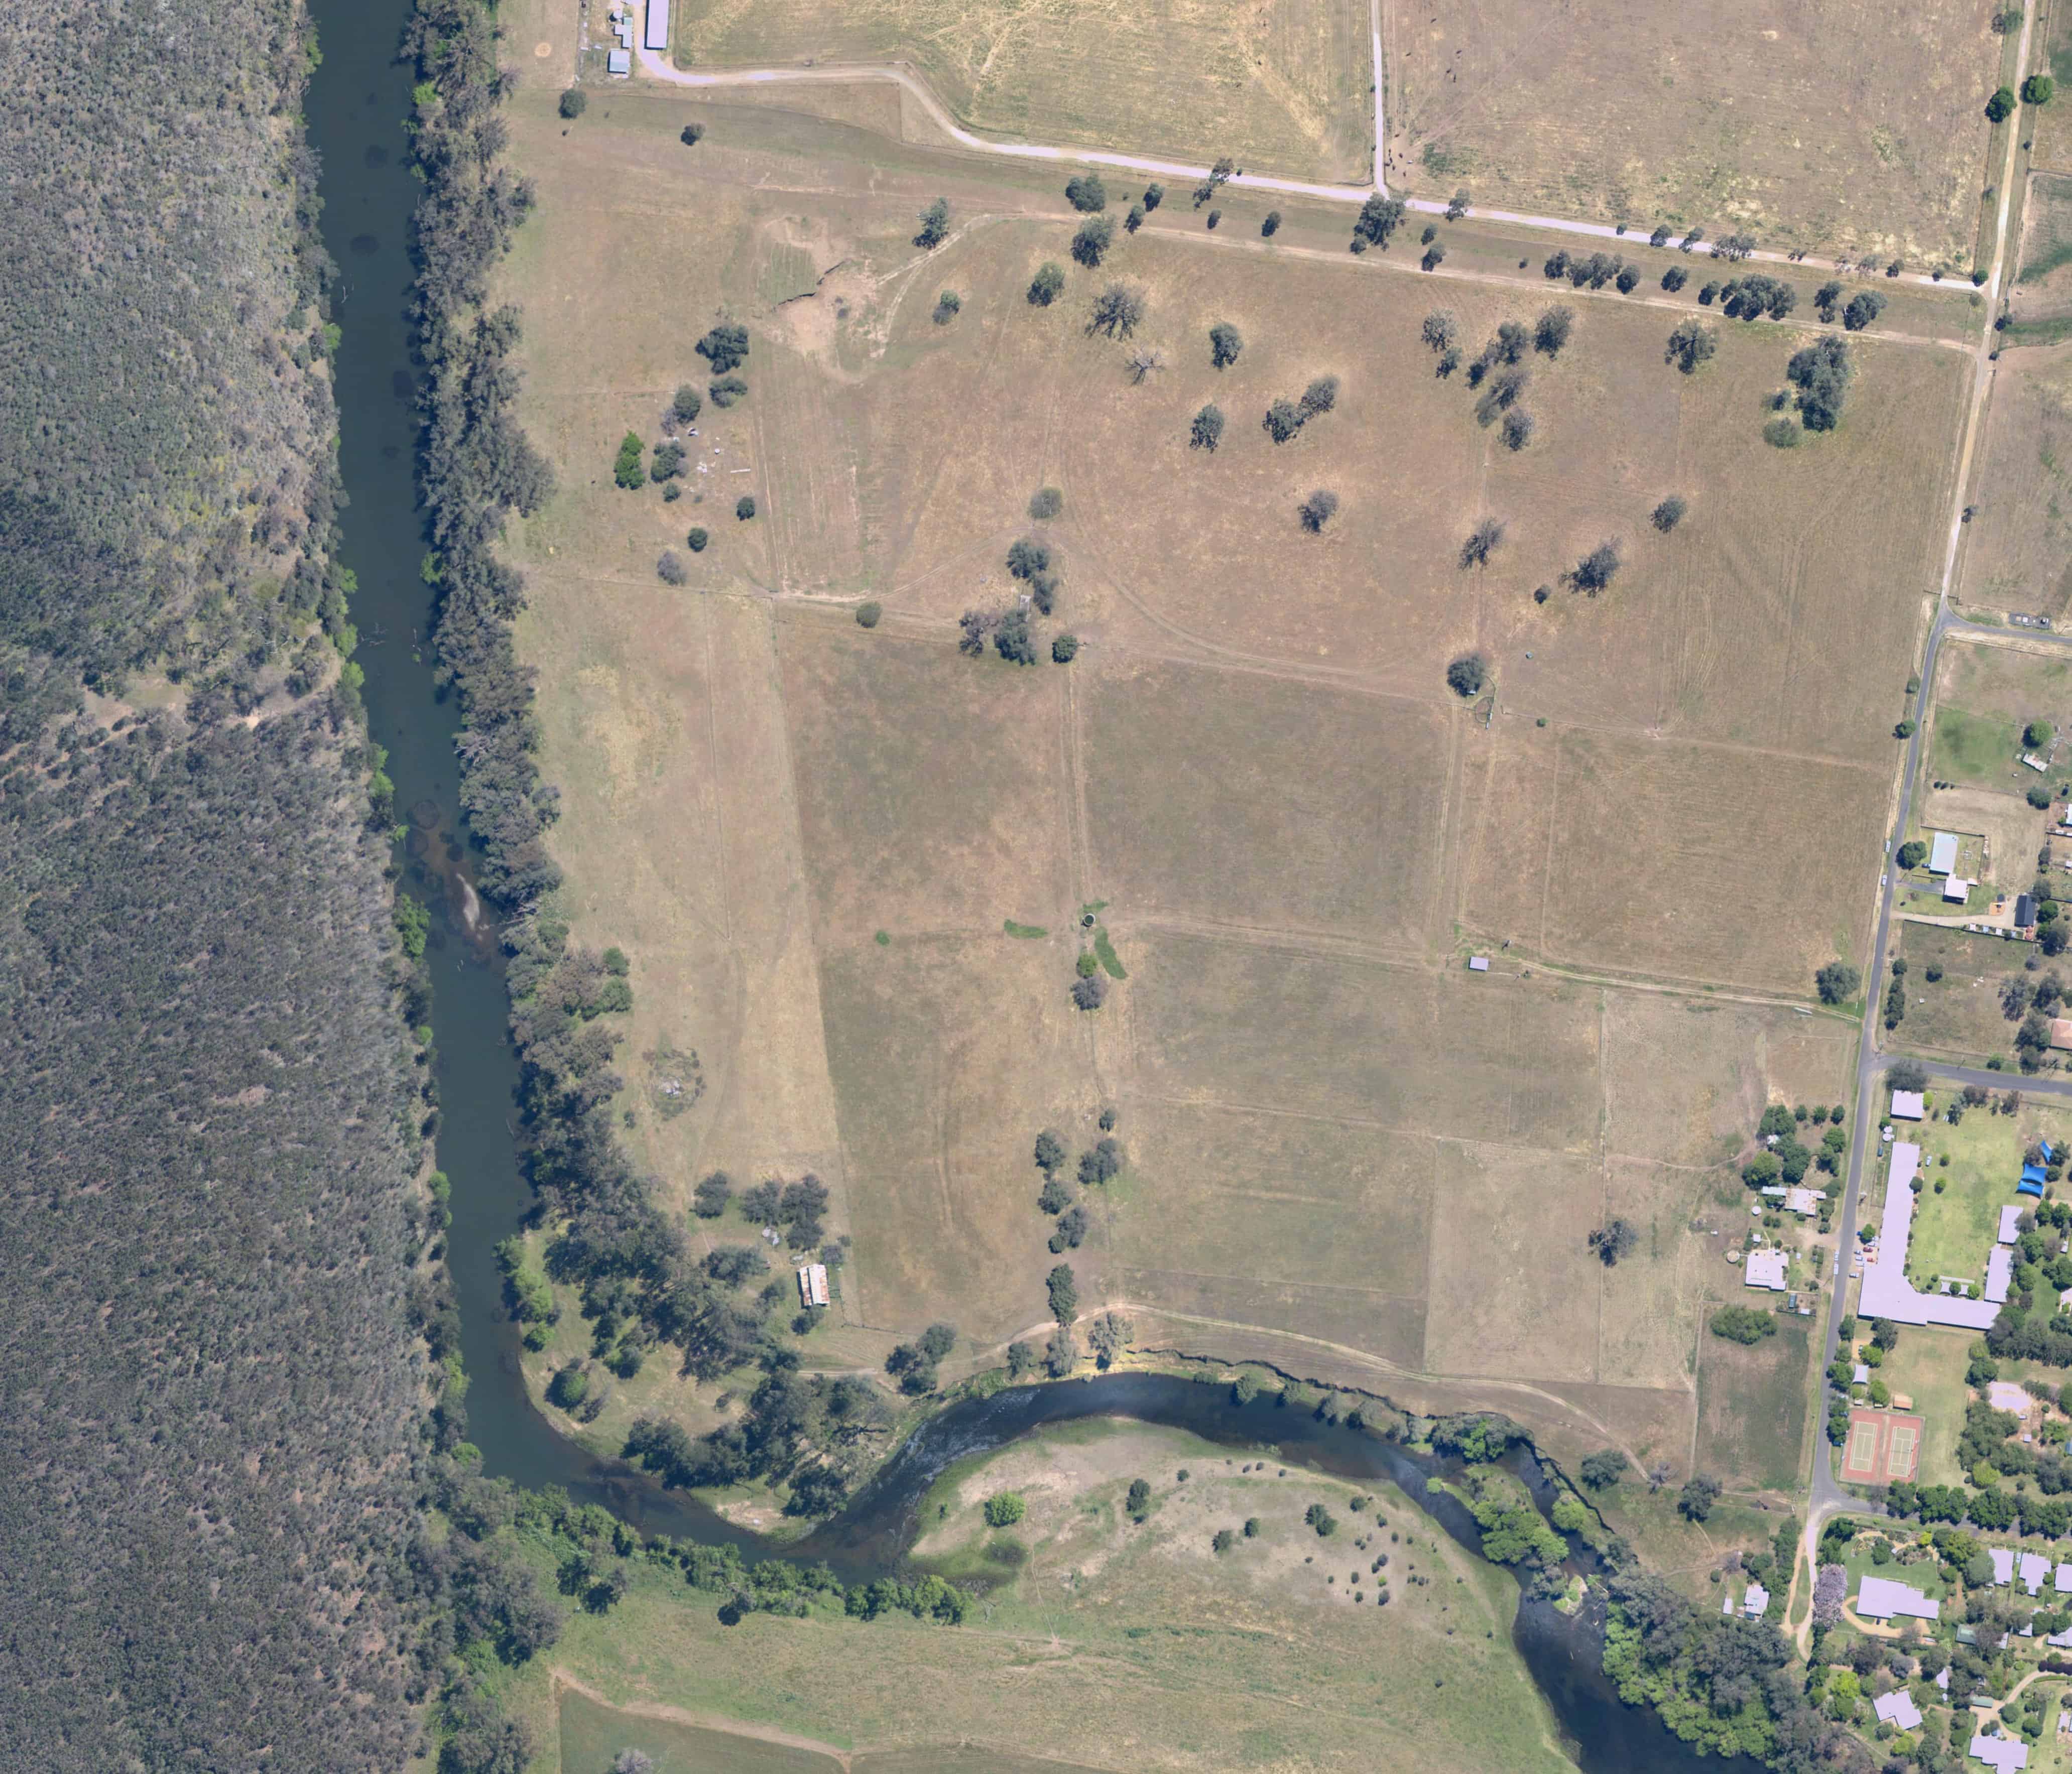
Current river bed aerial image.
A baseline for the extents of the erosion was determined from the original plan of survey for the site, being plan 402-1566 dated 1875. The bank shown on this plan appears to match the bank as shown on Portion 48 to the east, surveyed approximately 20 years before.
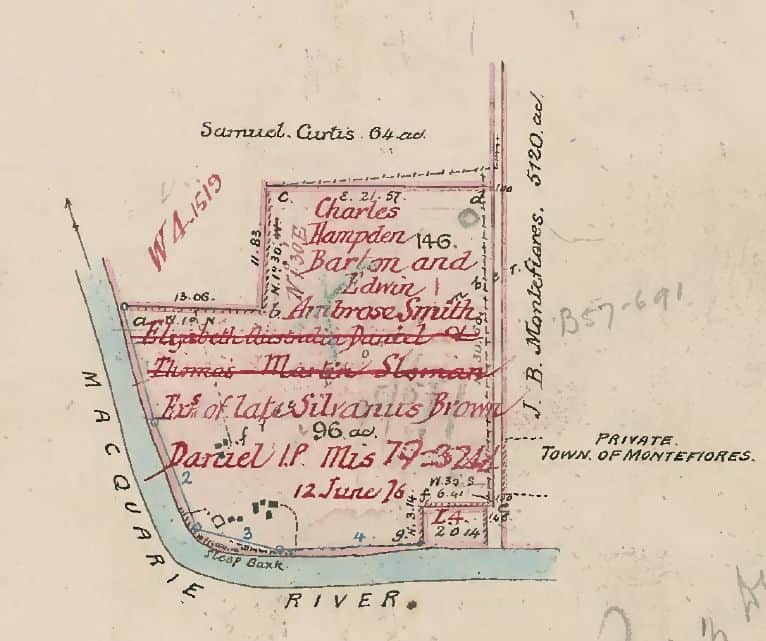
Plan 402-1566 dated 1875, showing the site of the erosion.
Although a survey of the site for subdivision was undertaken in 1972, in order to determine the rate and nature of the changes to the bank, more information was required. Historical aerial photos were used based on available images from Land and Property Information NSW. Images dated 1955, 1964, 1971, 1979, 1980, 1988, 1991, 1995, 1996, 2000, 2003, 2009 and 2014 were used. Not all images were suitable to be used for the project and 3 of the 12 images were discarded due to image quality or lack of time between the images resulting in either no changes to the bank or changes too small to determine.
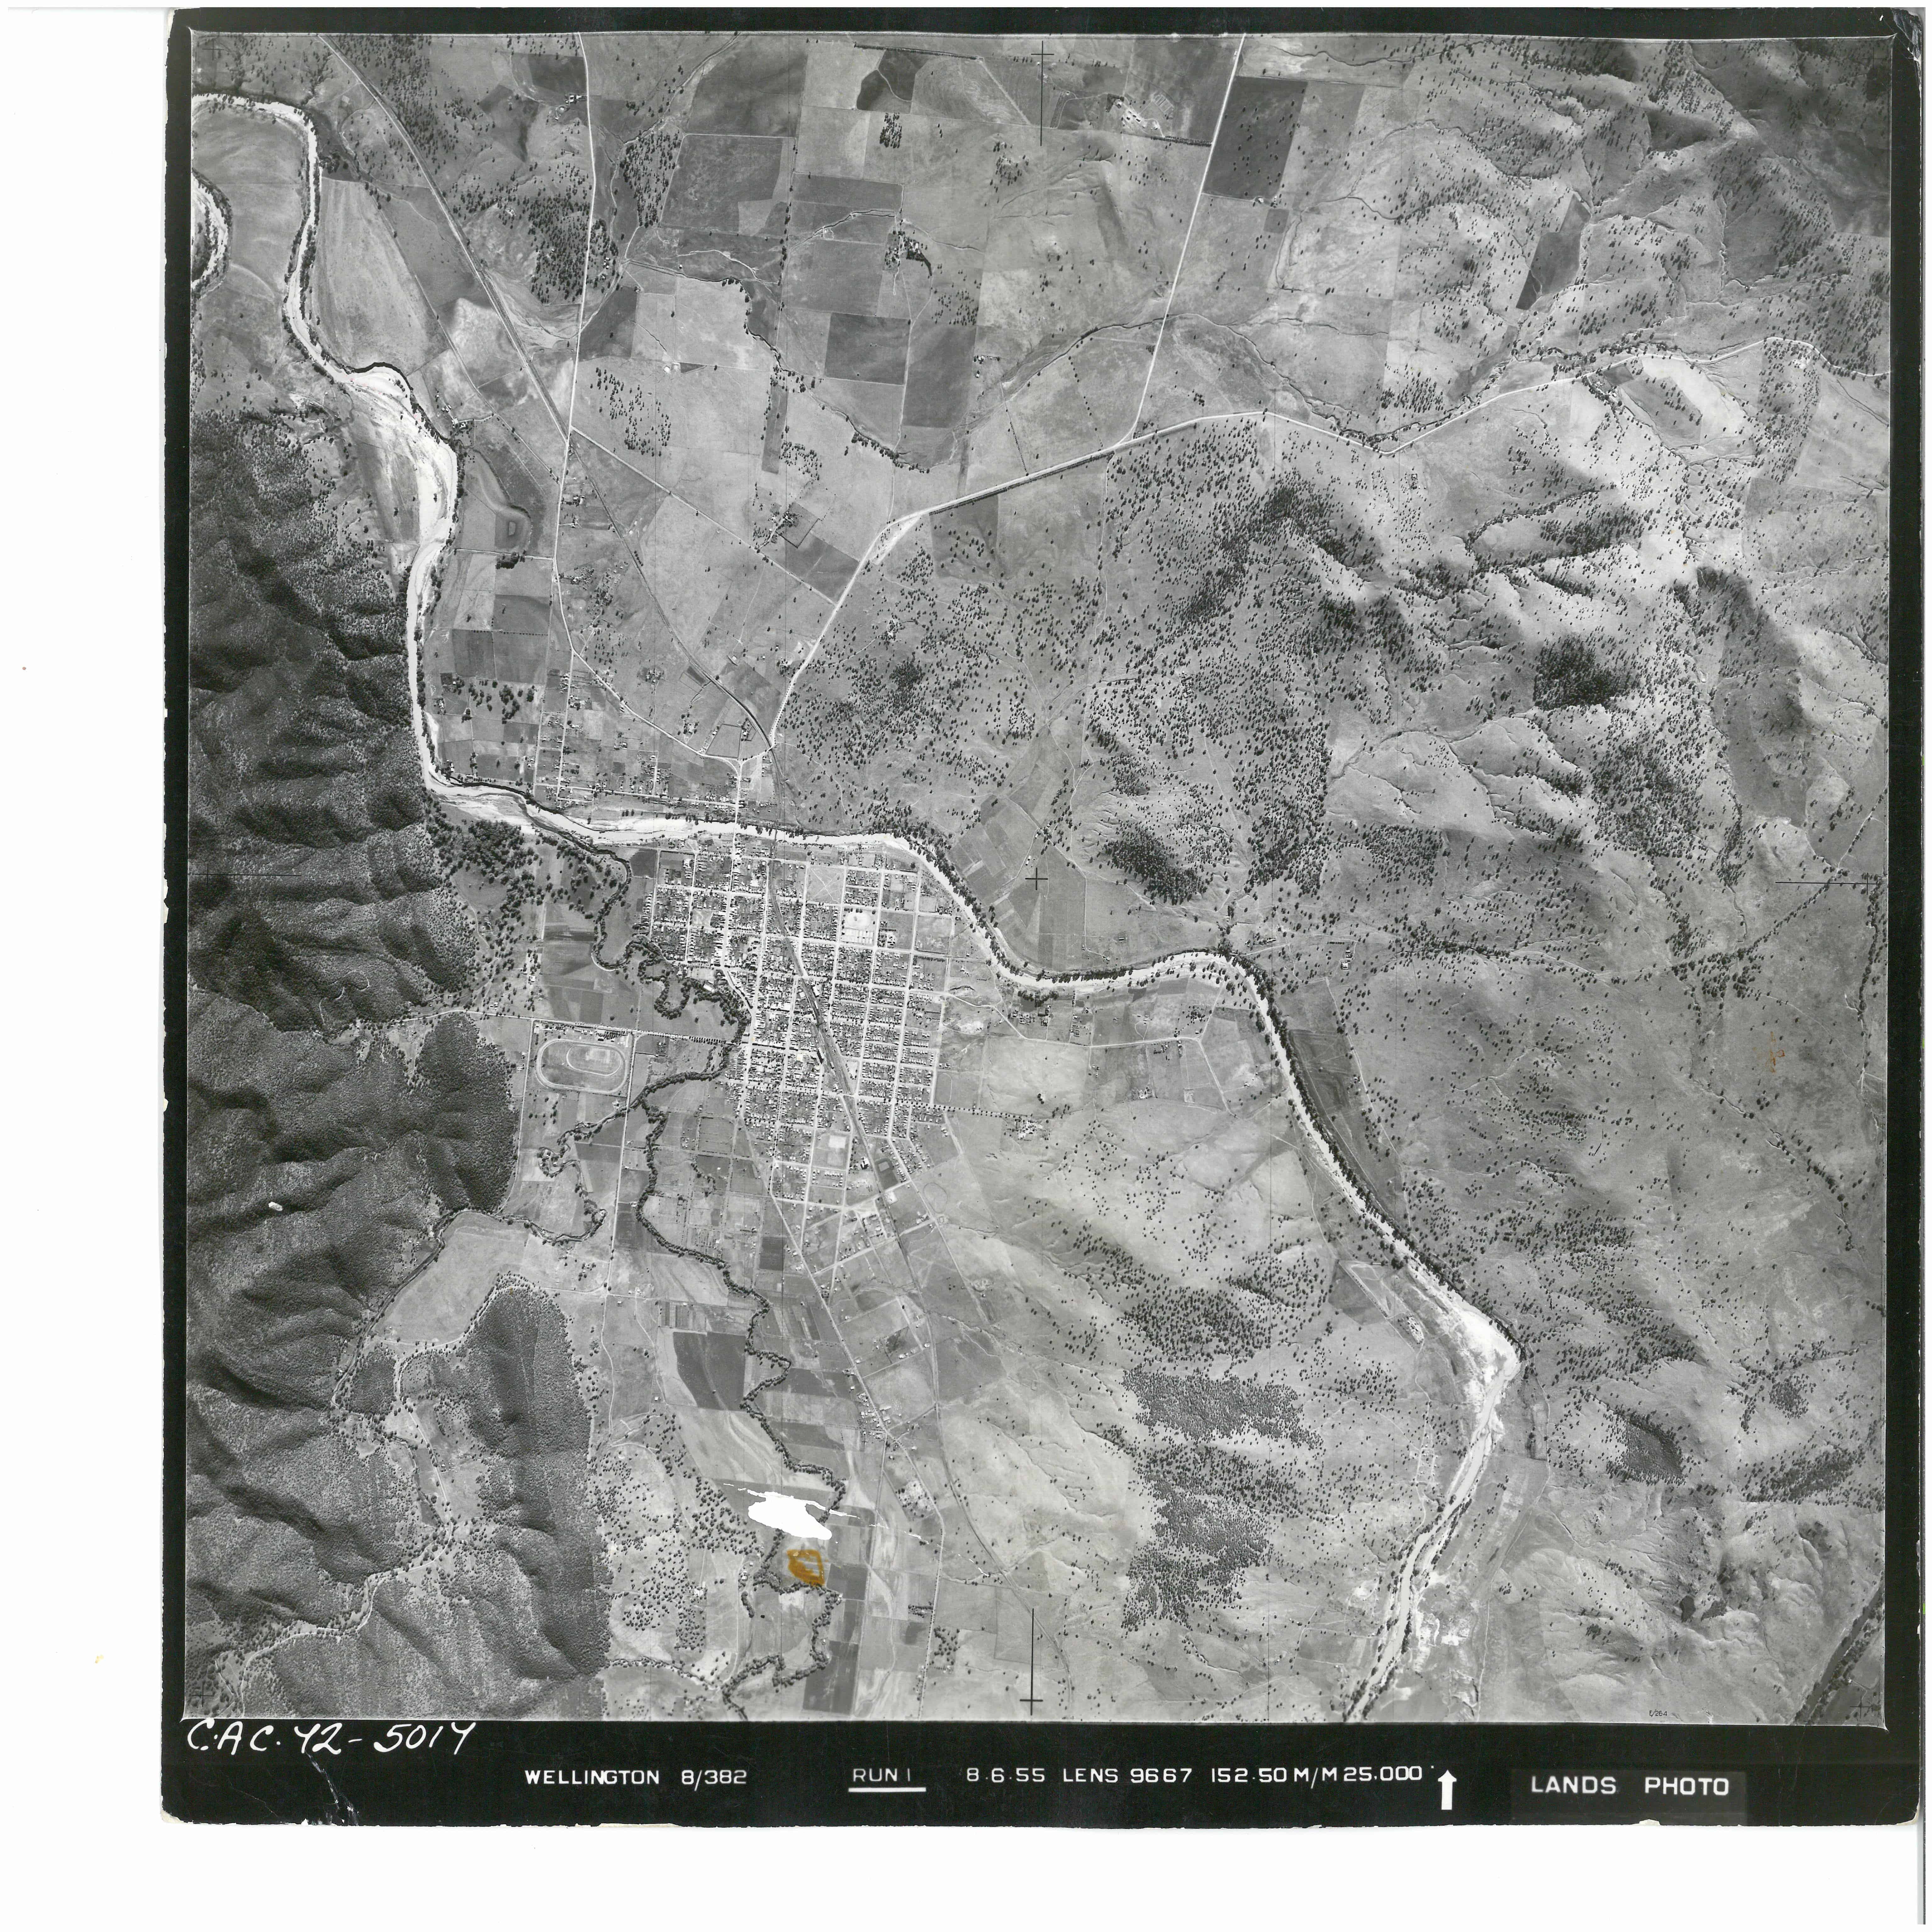
Aerial photo from 1955
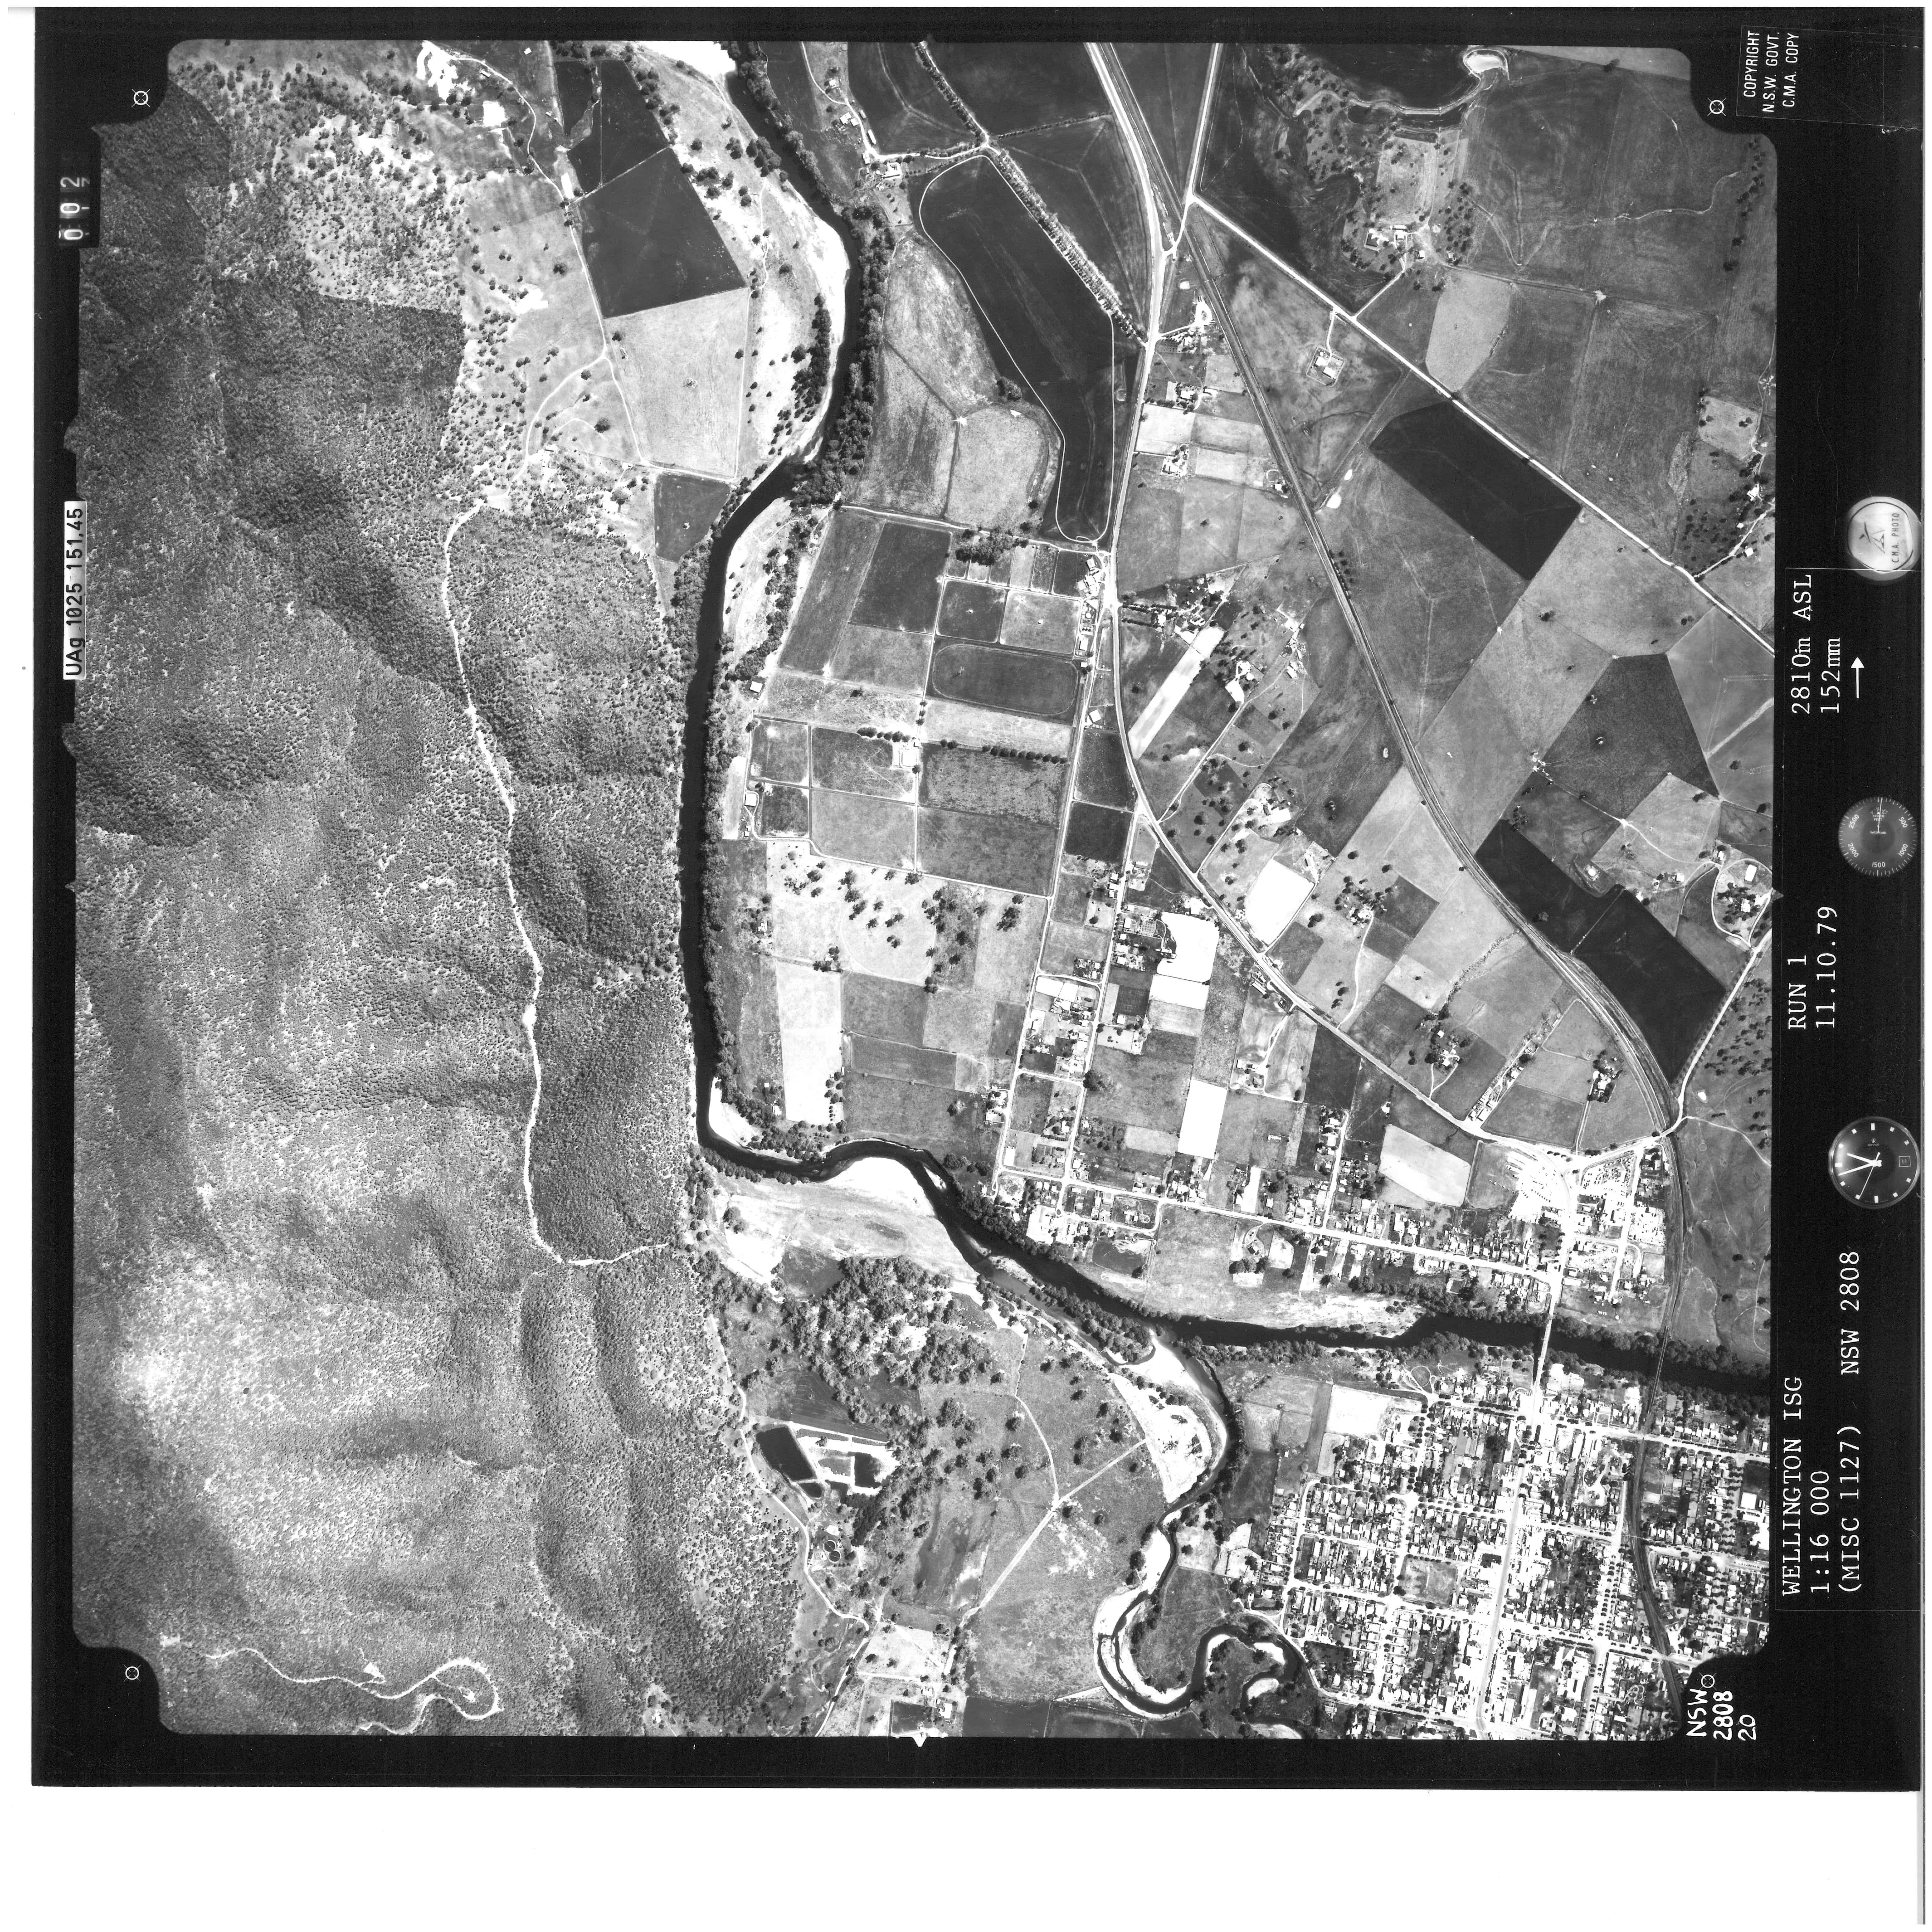
Aerial photo from 1979
Aerial photo from 2009
Aerial photographs were inserted as background images in survey software, localised to features measured by survey such as road intersections. Varying resolutions, contrast, times of year, vegetation, tilt of aircraft all affected the viability of each image. Generally each pixel in the image related to approximately 1 metre on the ground.
The maximum linear amount of erosion was compared for each time interval, as well as the eroded area in each time interval. The average linear erosion is 1 metre per year since 1875. The average area eroded each year is 500m² per year since 1875. Total erosion area lost since 1875 is estimated at 6.28 hectares or 15.5 acres. In volumetric terms, at 12 metres deep, this area equates to 75600 cubic metres – more than 300 Olympic swimming pools!
| Year | Erosion from previous | Total Erosion | Average From 1875 | |||
| Max Dist. (m) | Area (ha) | Max Dist. (m) | Area (ha) | Dist. (m) | Area (ha) | |
| 1875 | ||||||
| 1955 | 80 | 3.9 | 80 | 3.9 | 1.0 | 0.05 |
| 1964 | 22 | 0.8 | 91 | 4.7 | 1.0 | 0.05 |
| 1971 | 25 | 0.4 | 101 | 5.1 | 1.1 | 0.05 |
| 1979 | 33 | 0.5 | 129 | 5.6 | 1.2 | 0.05 |
| 1988 | 7 | 0.1 | 127 | 5.6 | 1.1 | 0.05 |
| 1991 | 17 | 0.2 | 133 | 5.9 | 1.1 | 0.05 |
| 1996 | 6 | 0.0 | 133 | 5.9 | 1.1 | 0.05 |
| 2000 | 24 | 0.2 | 133 | 6.1 | 1.1 | 0.05 |
| 2003 | 8 | 0.1 | 136 | 6.2 | 1.1 | 0.05 |
| 2009 | 5 | 0.0 | 136 | 6.2 | 1.0 | 0.05 |
| 2014 | 13 | 0.1 | 140 | 6.3 | 1.0 | 0.05 |
The NSW Office of Water flood data was analysed to determine whether major erosion is linked to peak flows. Correlation can be seen between flood events and erosion on the site. This data is valuable as there were concerns that controlled releases from Burrendong Dam upstream were causing erosion to be exacerbated.
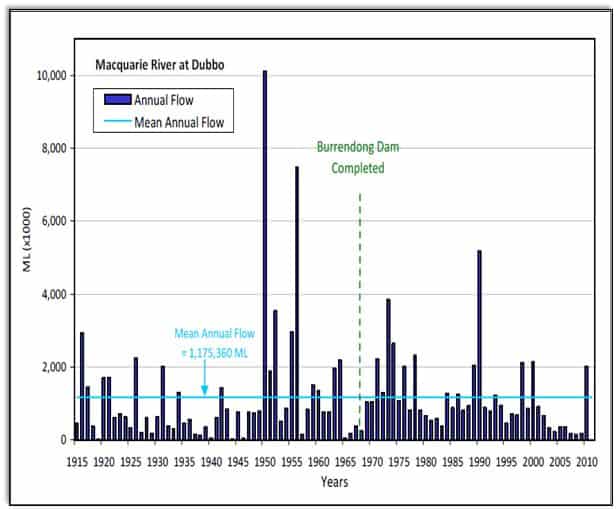
Flood data from Macquarie River from NSW Office of Water records.
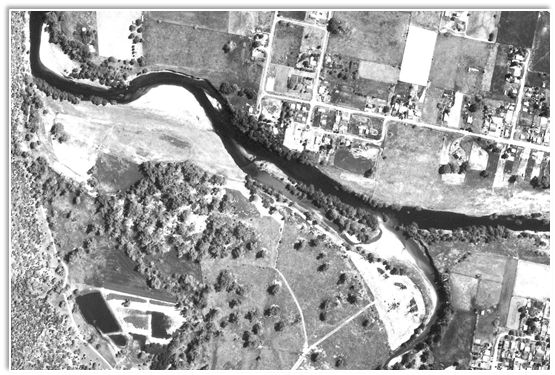
A significant flood event occurred on the Bell River in 1971. The 1971 aerial photograph is shown below and the Bell River junction can be seen at the eastern end of the site.
1971 Aerial photo extract
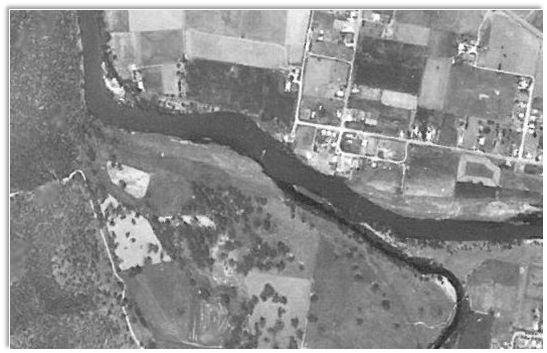
After the 1971 flood event, the junction of the Bell River with the Macquarie River was greatly changed – 1979 aerial photo shown below:
1979 Aerial photo extract
The Bell River junction today is similar to the 1979 image:
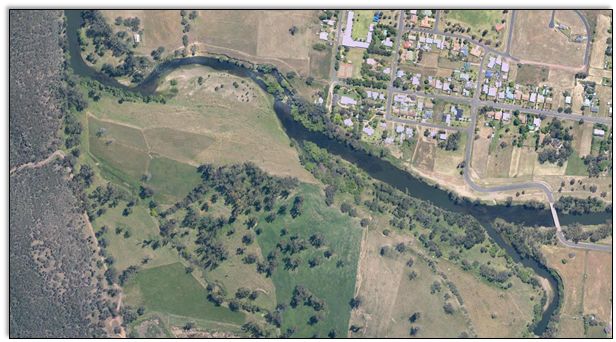
2014 Aerial photo
To give some historical context to the changes, old data was searched and analysed. Plan 7-1567 is of land located directly south of the Macquarie River from the subject land. This plan shows the river as it was in 1856 and shows an island with several interconnecting streams.
Extract from plan 7-1567 dated 1856, located south of the investigation site. Note the interconnecting streams and the area annotated as “island”.
In 1937, a survey was performed on the island shown above, claiming this as land in Portion 160 shown on plan 3889-1567.
Extract from plan 3889-1567 dated 1937, claiming the land previously shown as an island, now viable land.
How does this fit in with what we see today? Are we seeing a small part of a long-term change?
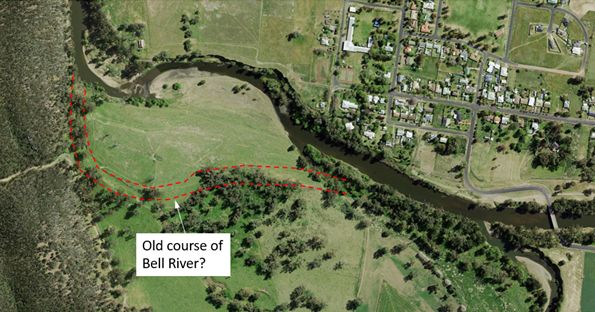
Is this the old course of Bell River?
The changes to the bank are dramatically shown in the animated image below:
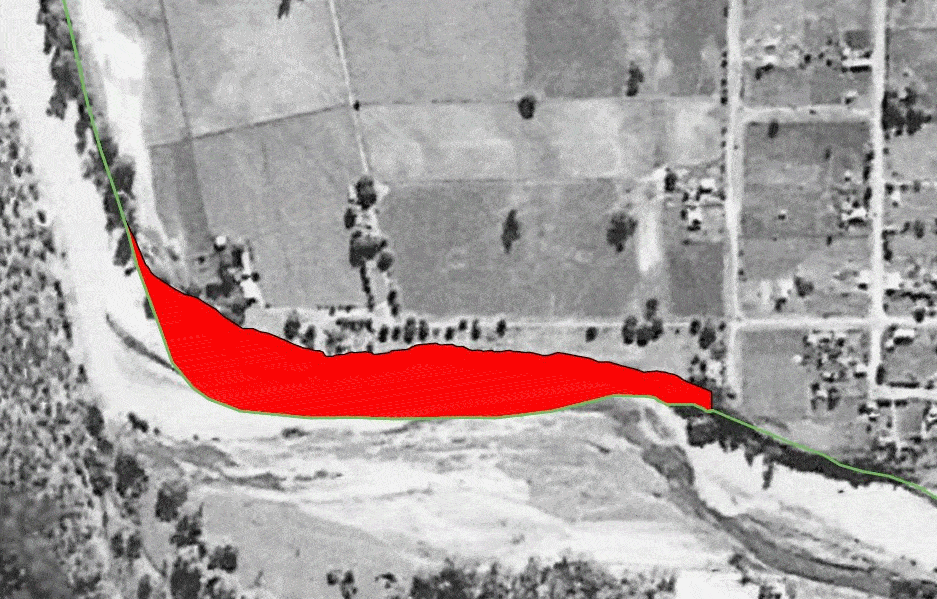
Animation of changes to river. Green line approximates bank from 1875. White hatching shows total area lost while red represents change from previous aerial photograph. Click on image to view.
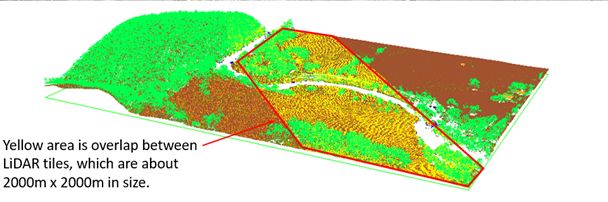
The current survey of the site was prepared from a combination of LiDAR (Light Detection and Ranging) data and ground survey by GPS and total station (infrared). Doherty Smith & Associates obtained LiDAR data for Wellington dated 2009. The data was processed by specifying the area of interest and filtering out the vegetation and buildings. The LiDAR data contains approximately 1 measurement per square metre. For the study area, this was almost 200,000 individual points.
Even though LiDAR has a large amount of data, there are some issues:
- Discrete points on bank lines are not necessarily captured.
- LiDAR does not work on water bodies.
- Large data files makes working with the model cumbersome.
- There are no breaklines in the model which can lead to inaccuracies.
There are several positive aspects to LiDAR:
- Extremely cost effective way to capture a terrain model over a large area.
- Data output is customisable.
- Data can be “thinned” for easier data handling and reduction in file sizes.
- Water edges can be modelled as they are voids in the data.
- Heights are excellent and have been ground truthed to within 20mm.
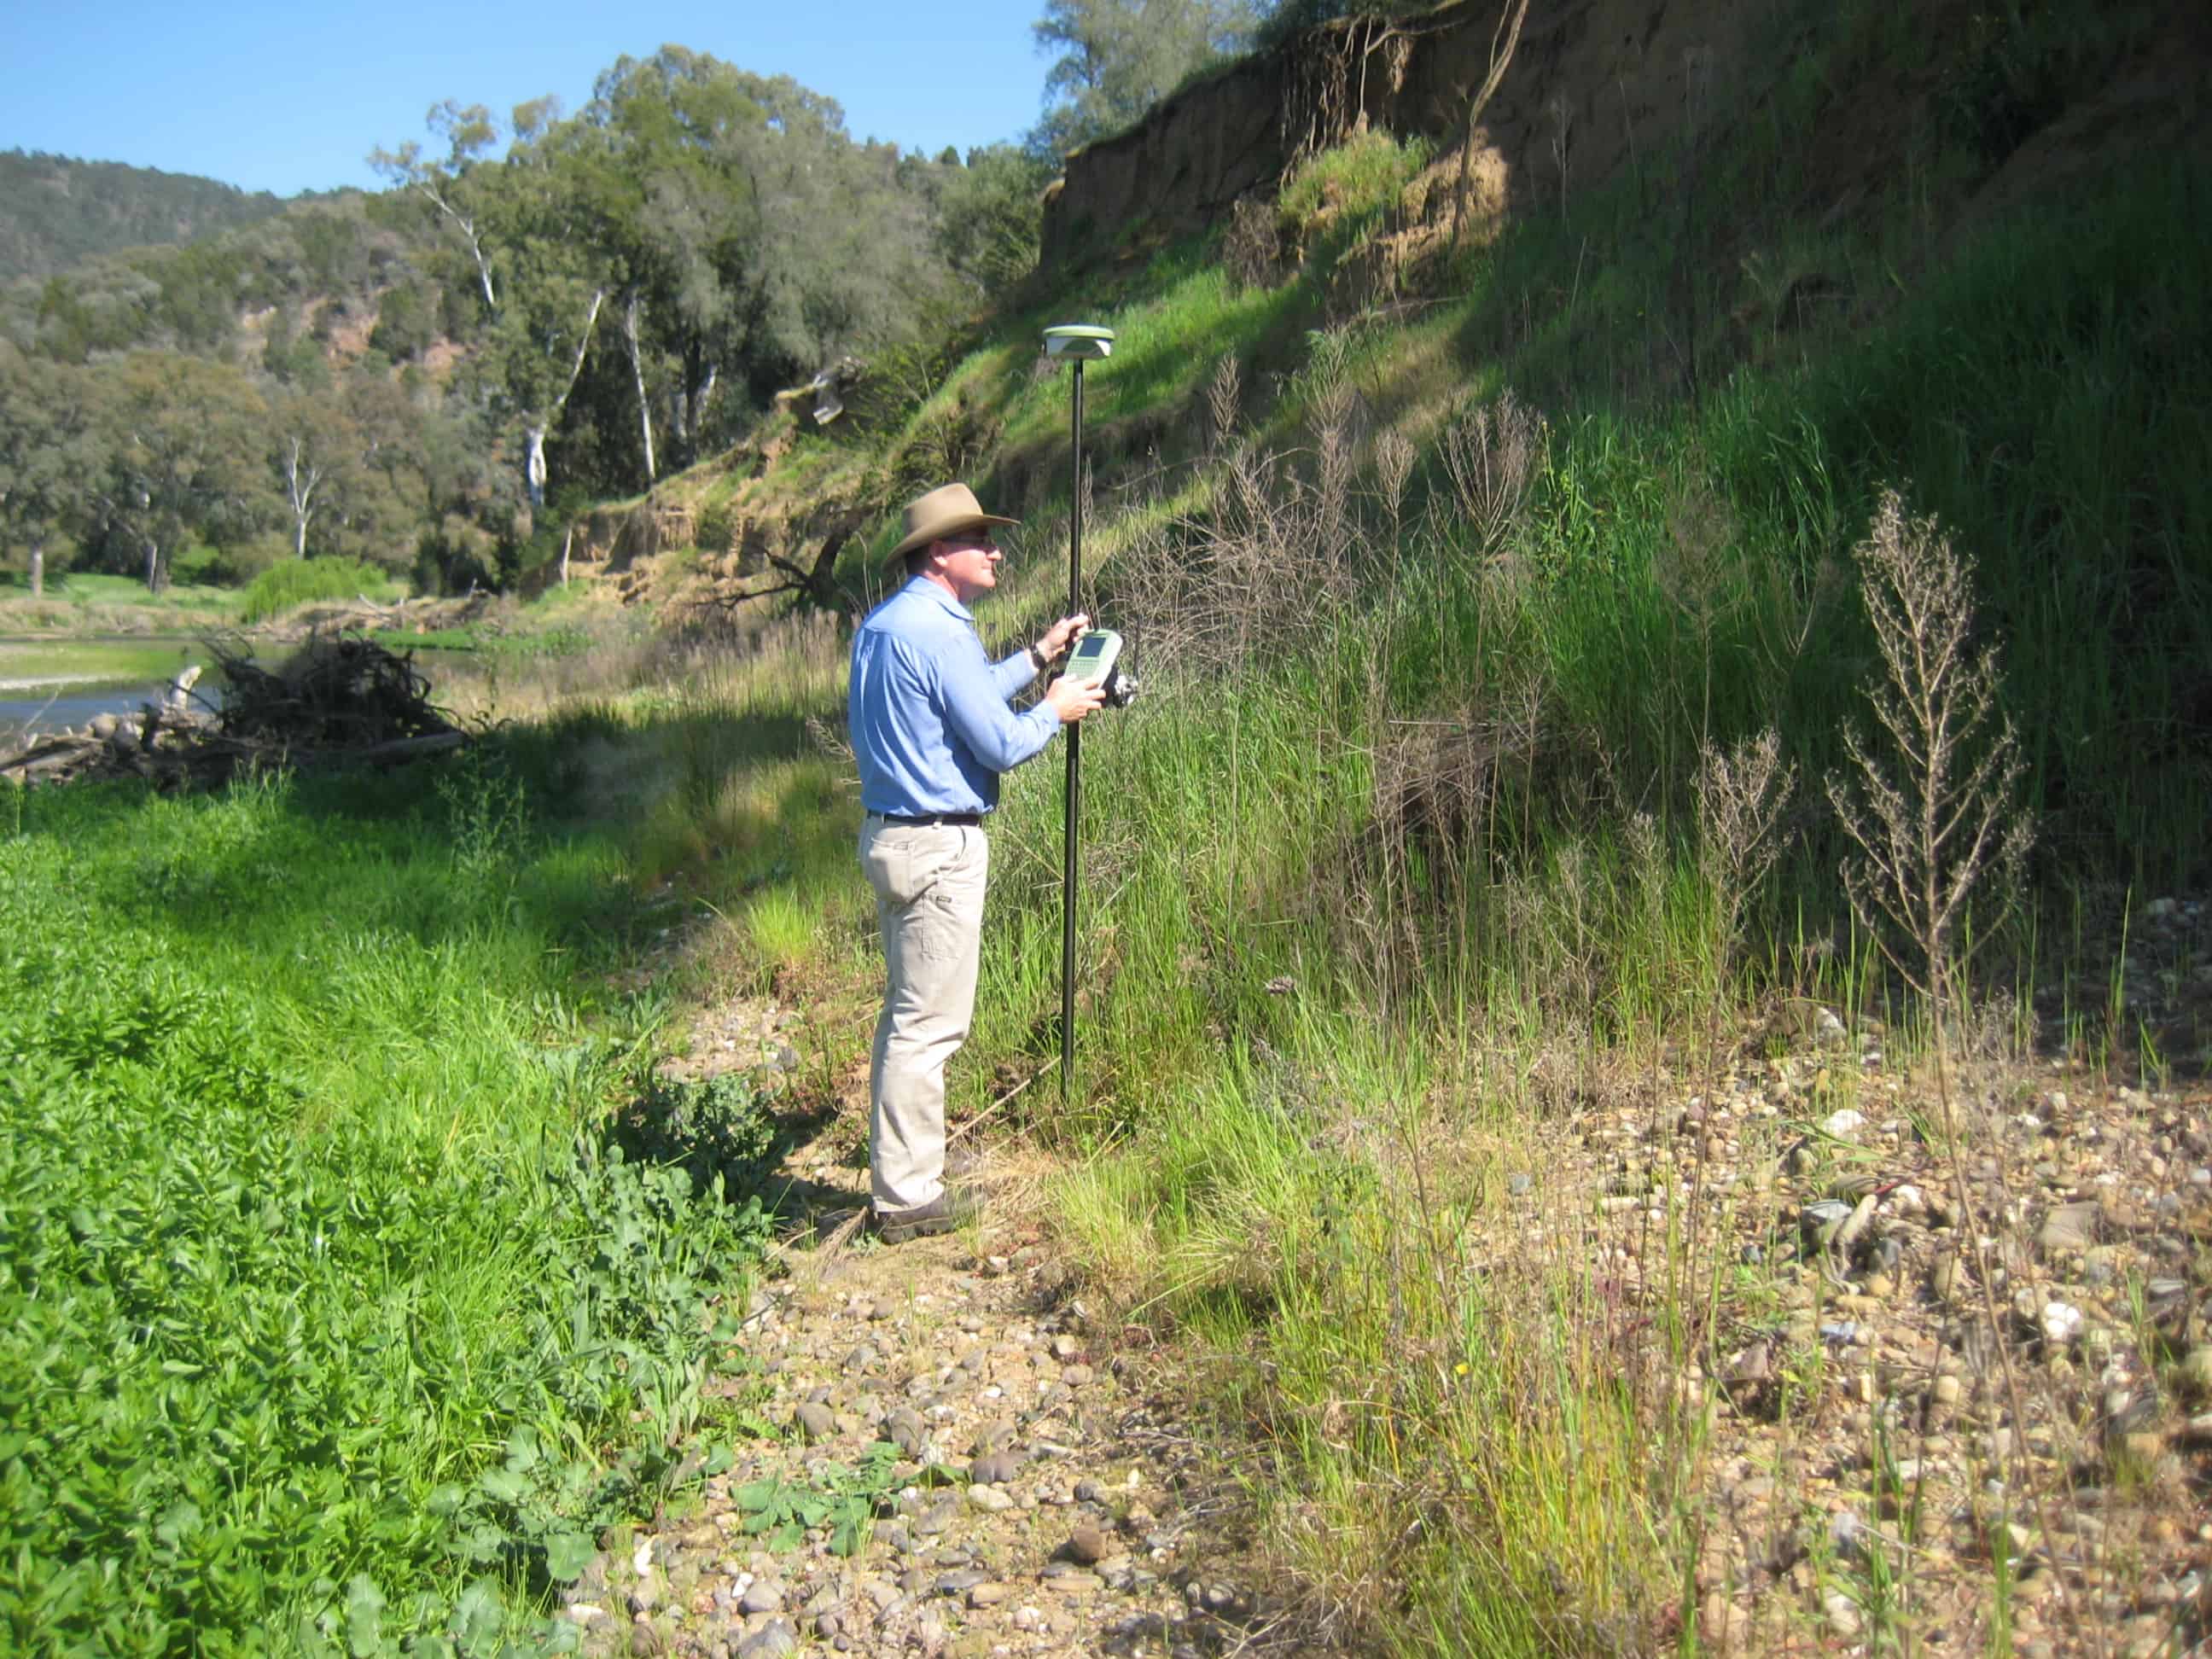
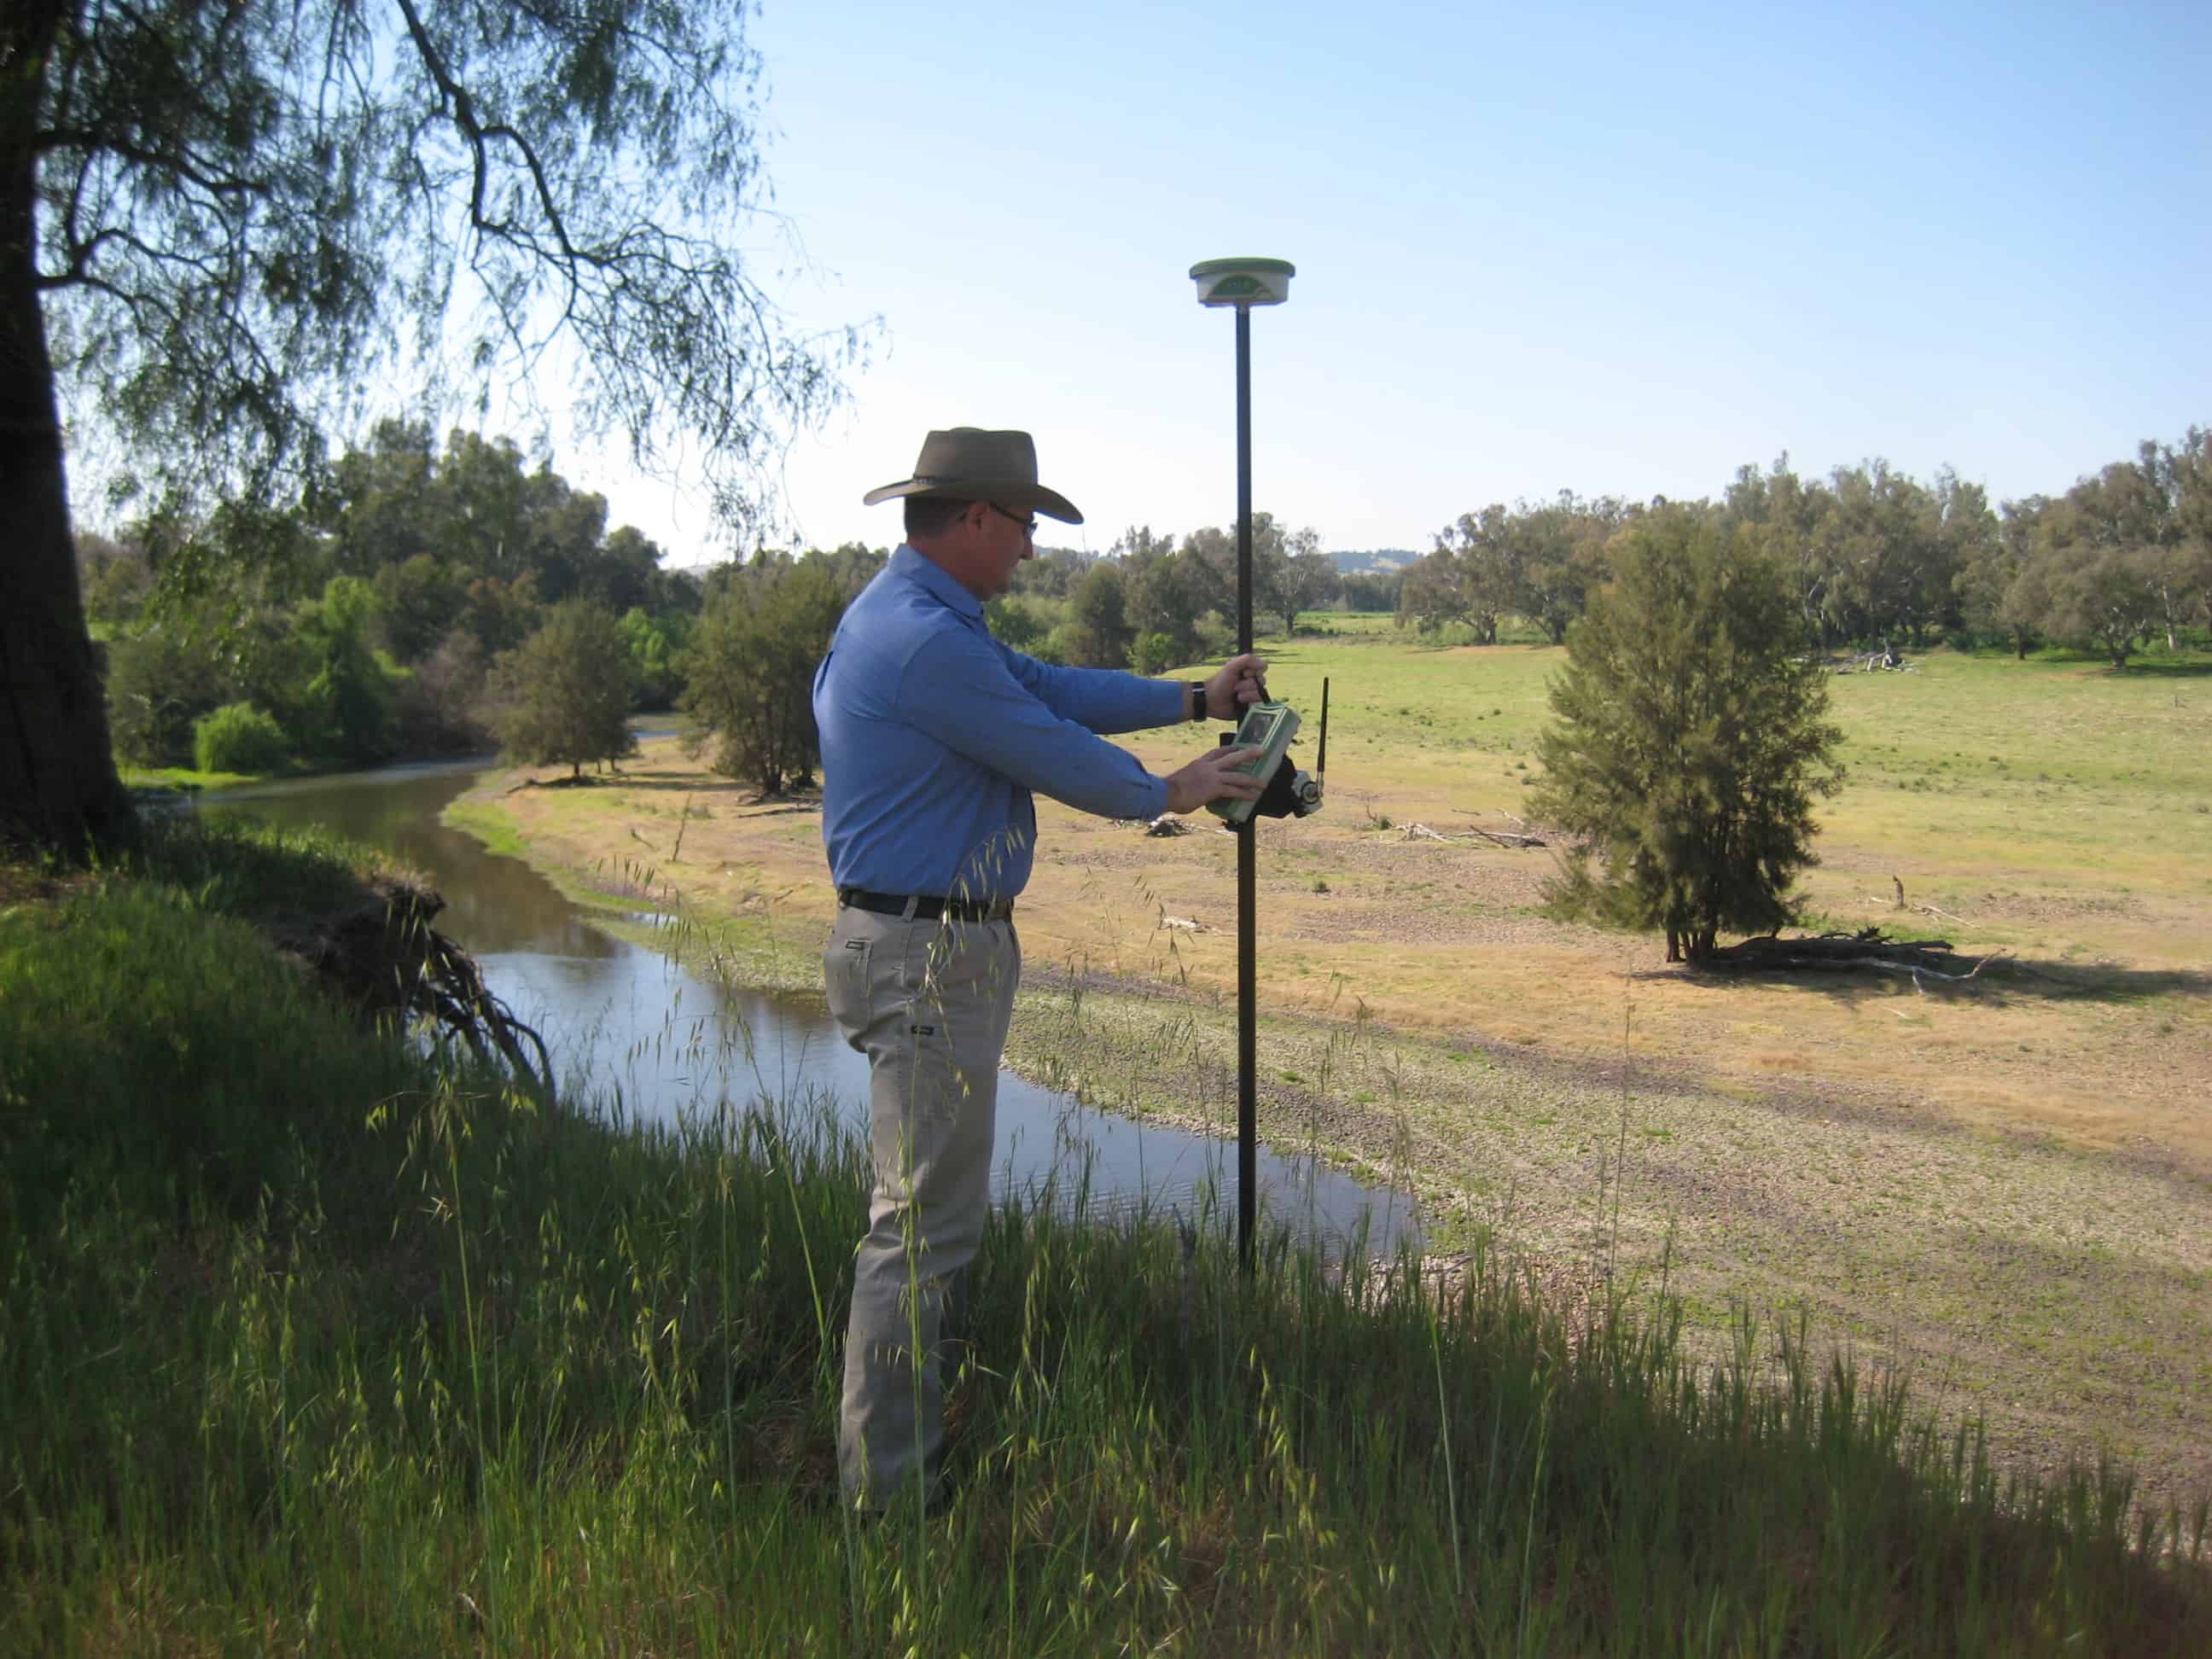
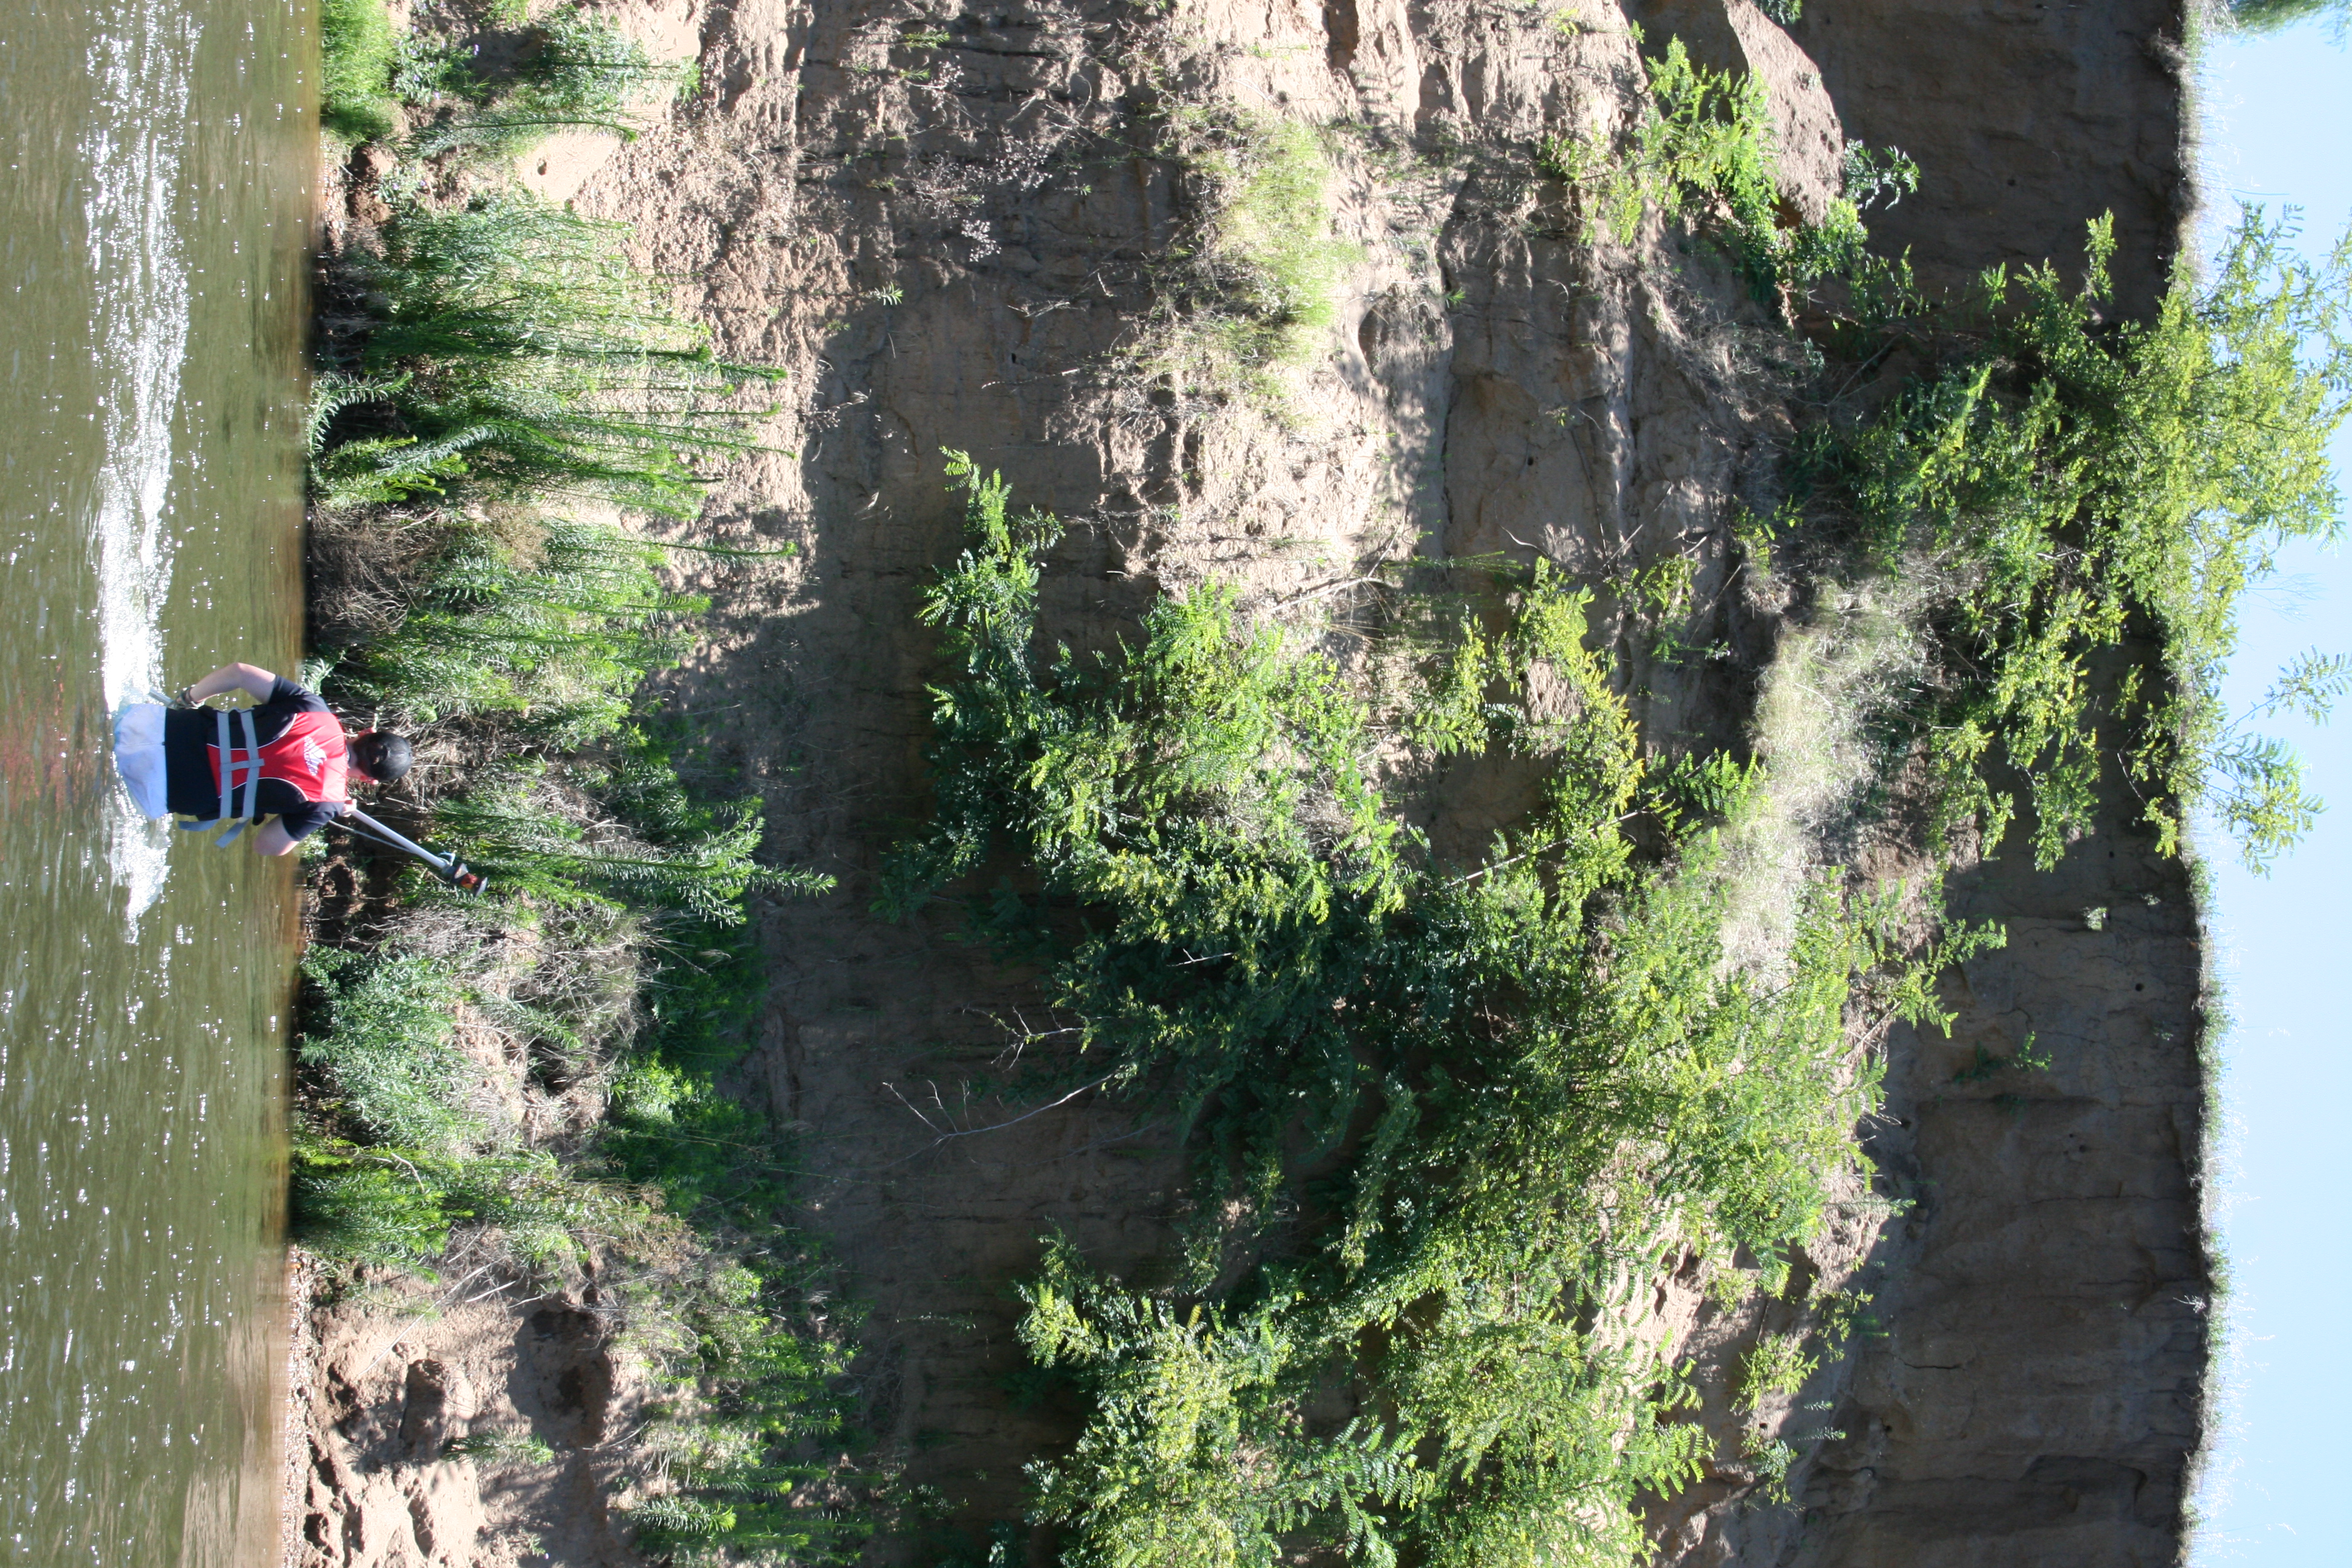
In September 2014, a ground survey was performed using RTK GPS to locate the banks and water level for monitoring purposes.
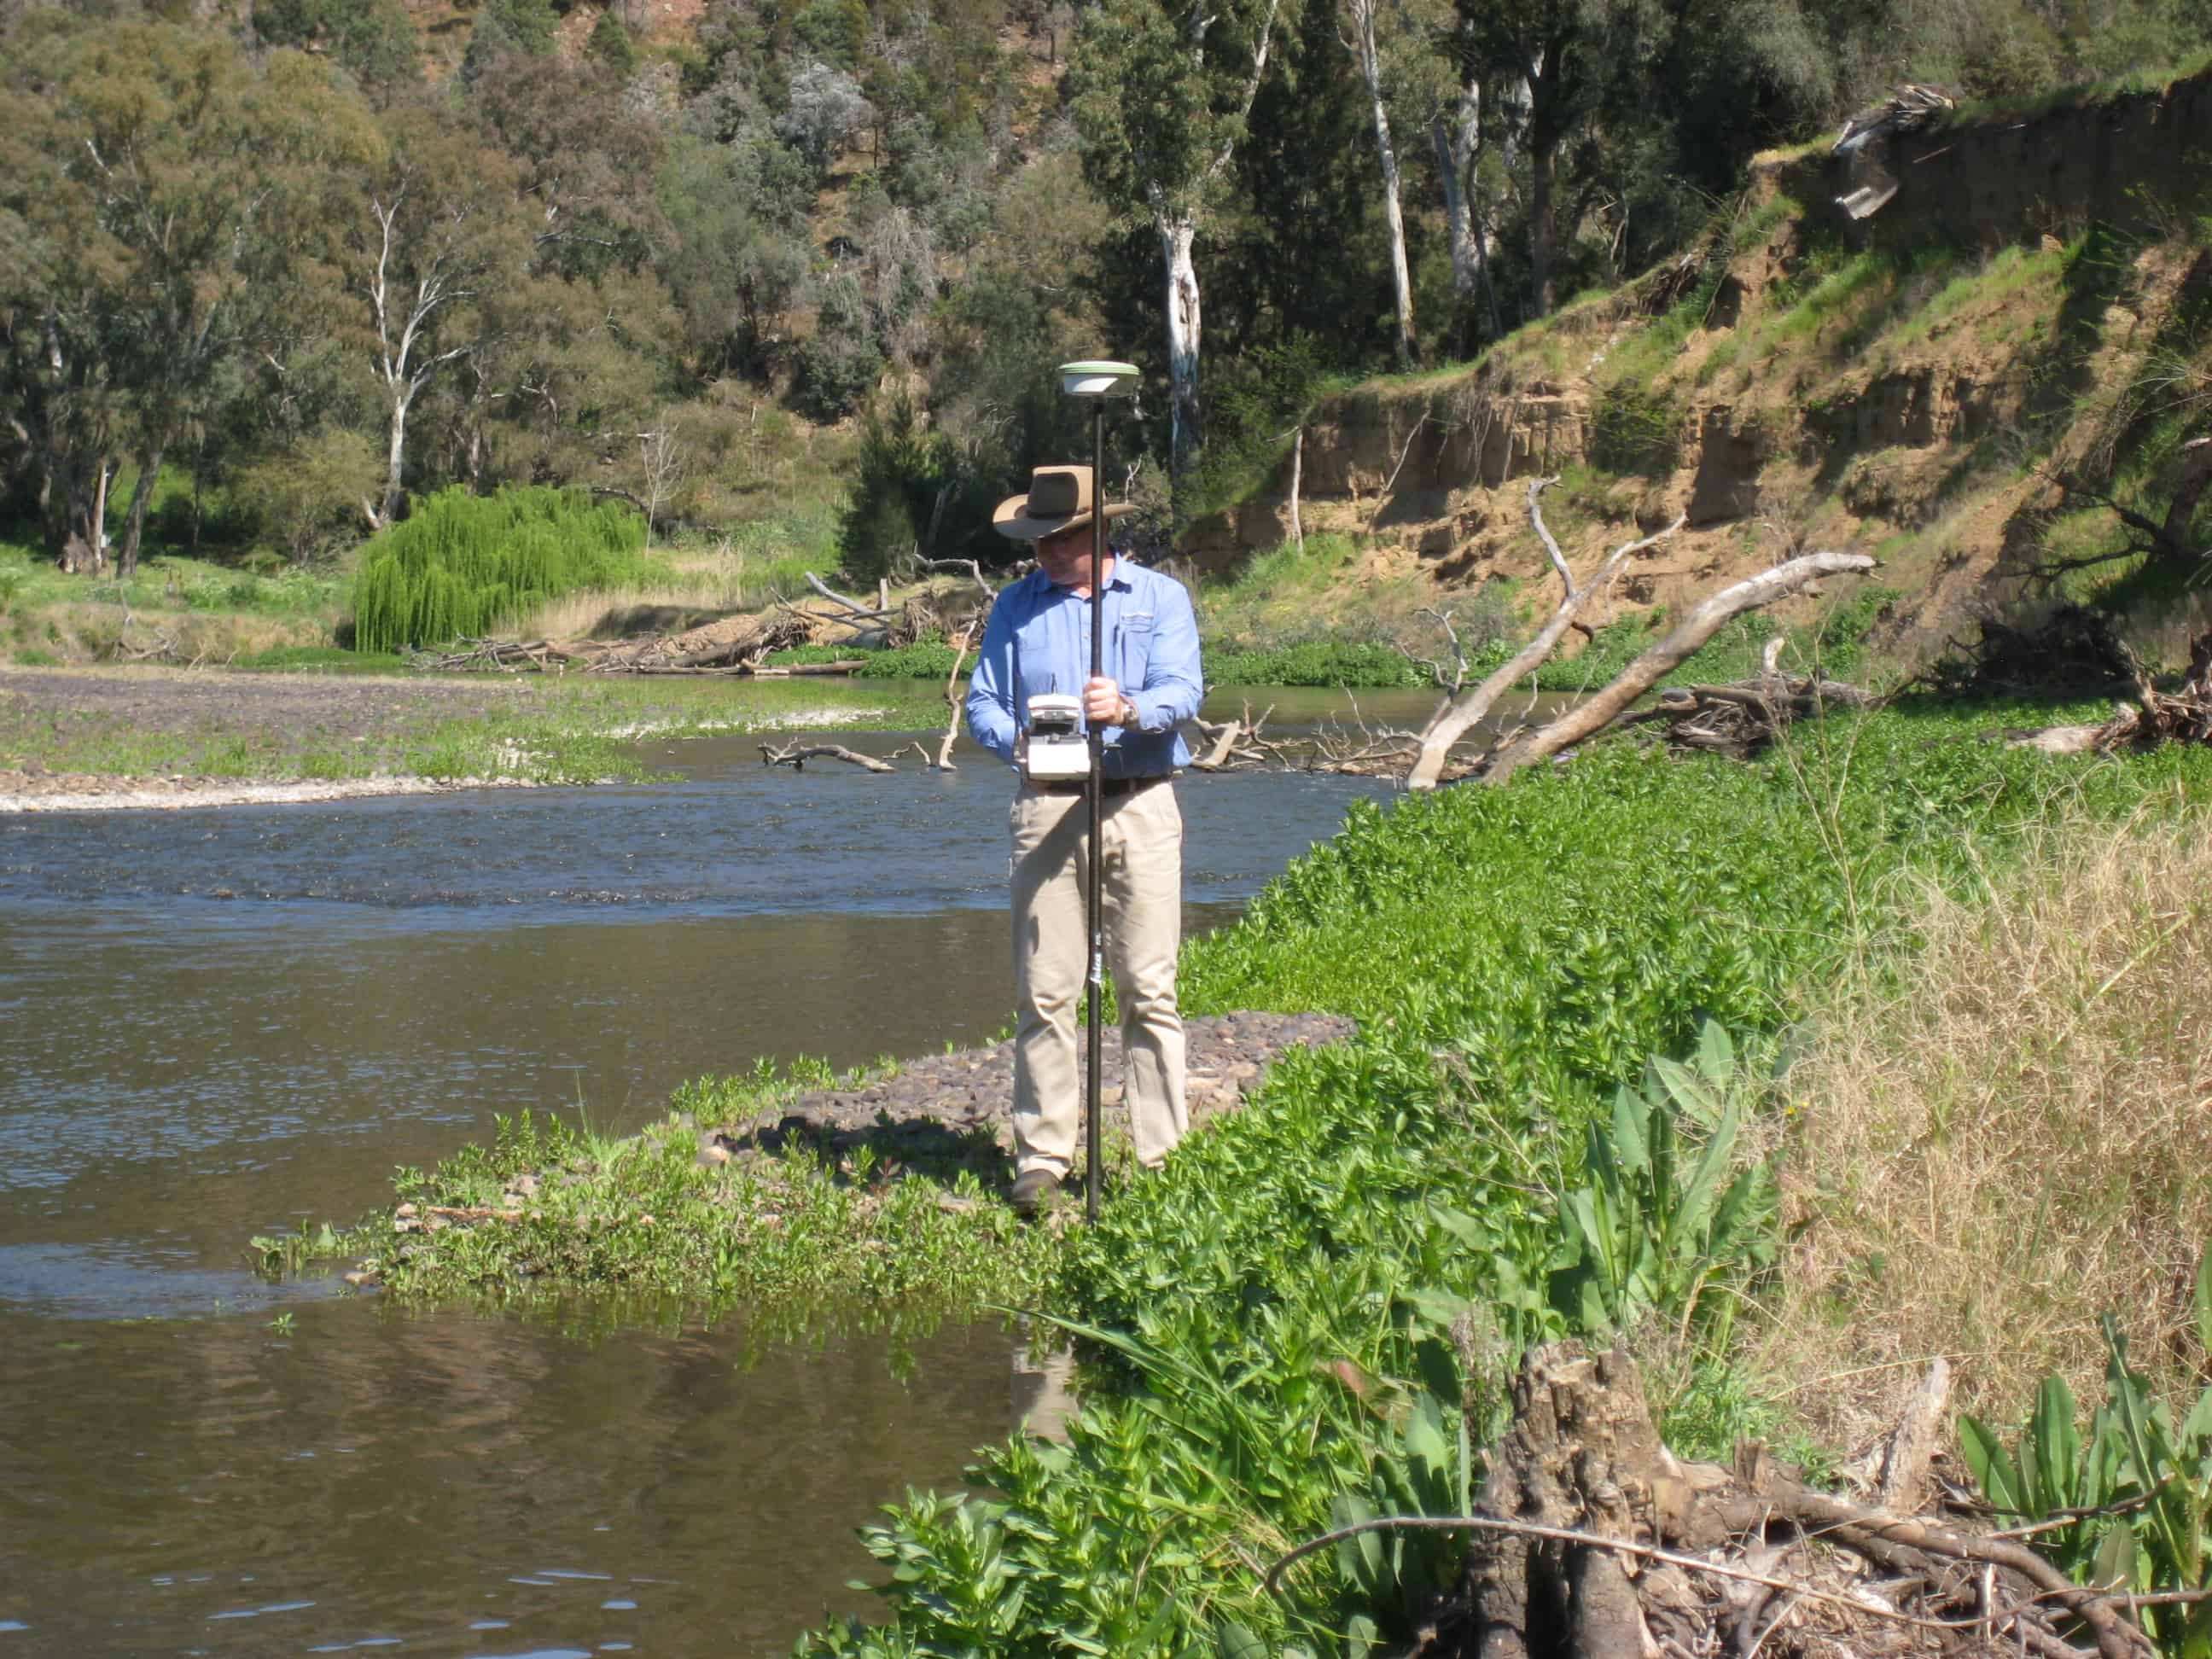
Surveyor Eric Smith locating the water level of the Macquarie River, September 2014
Surveyor Eric Smith locating the toe of the talus bank, September 2014
Surveyor Eric Smith locating the top of the high bank, September 2014
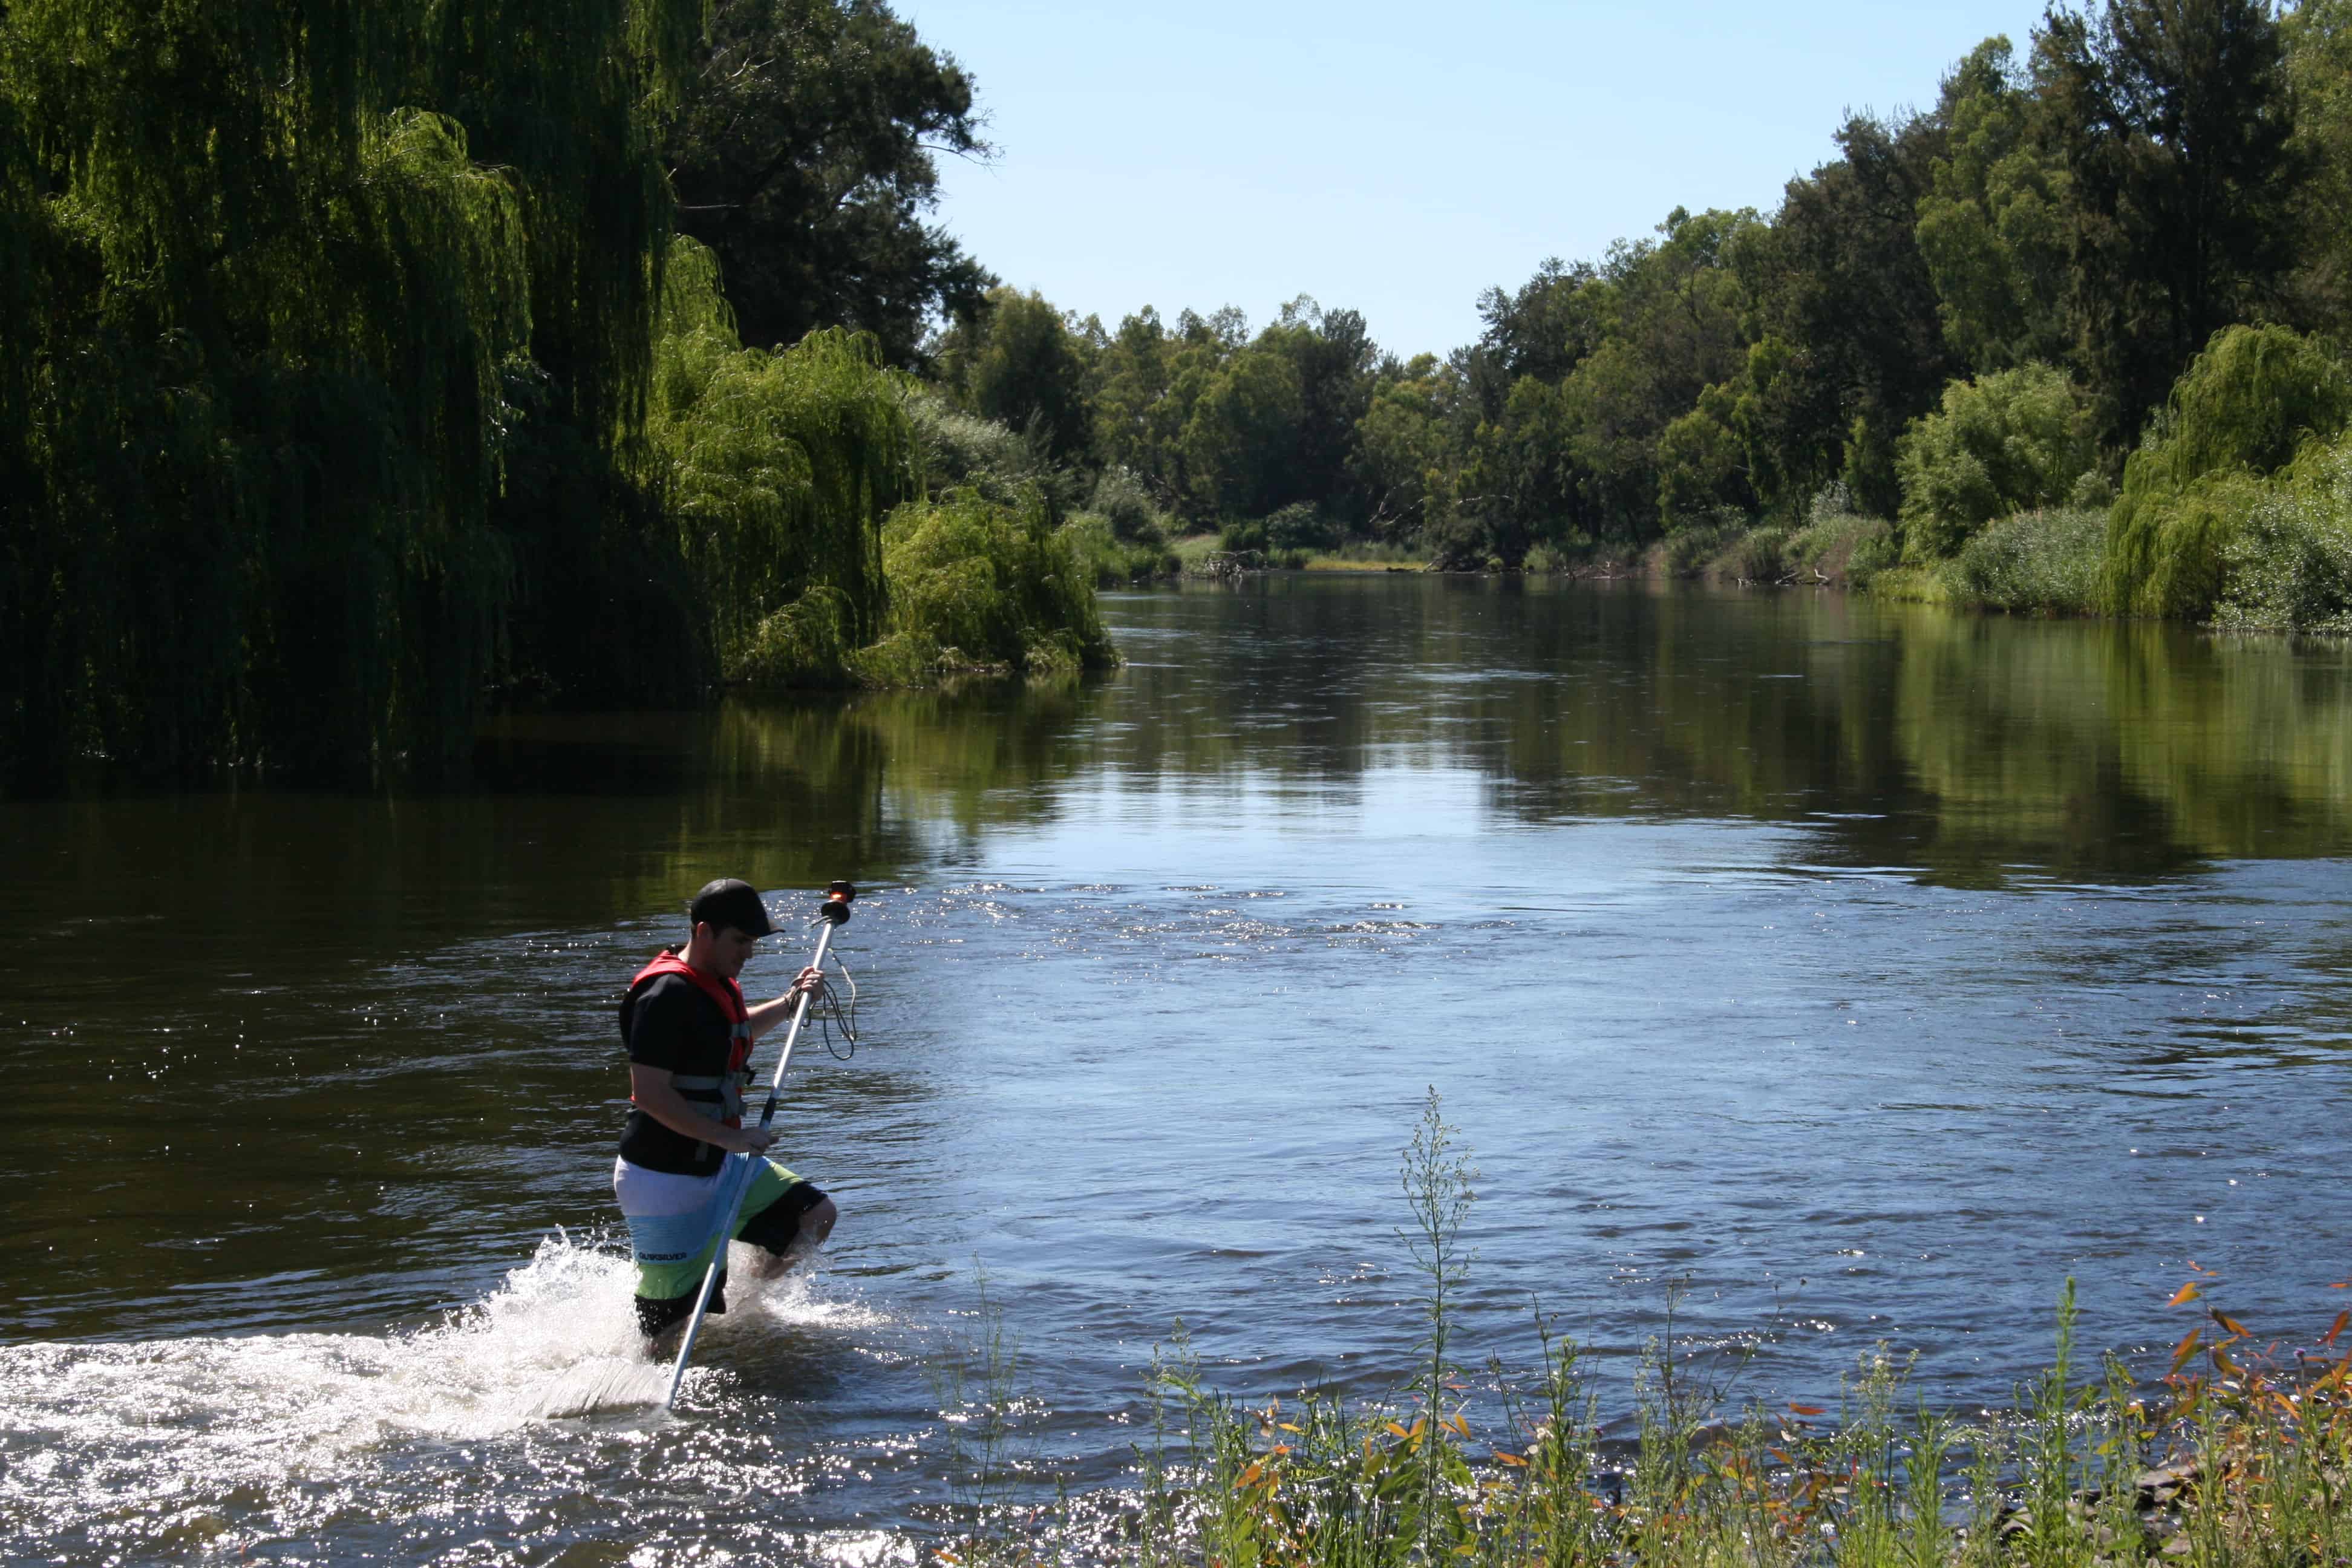
In January 2015, the September 2014 survey data was augmented by a survey of the river bed.
Jesse Schweida measuring the bed of the Macquarie River, January 2015
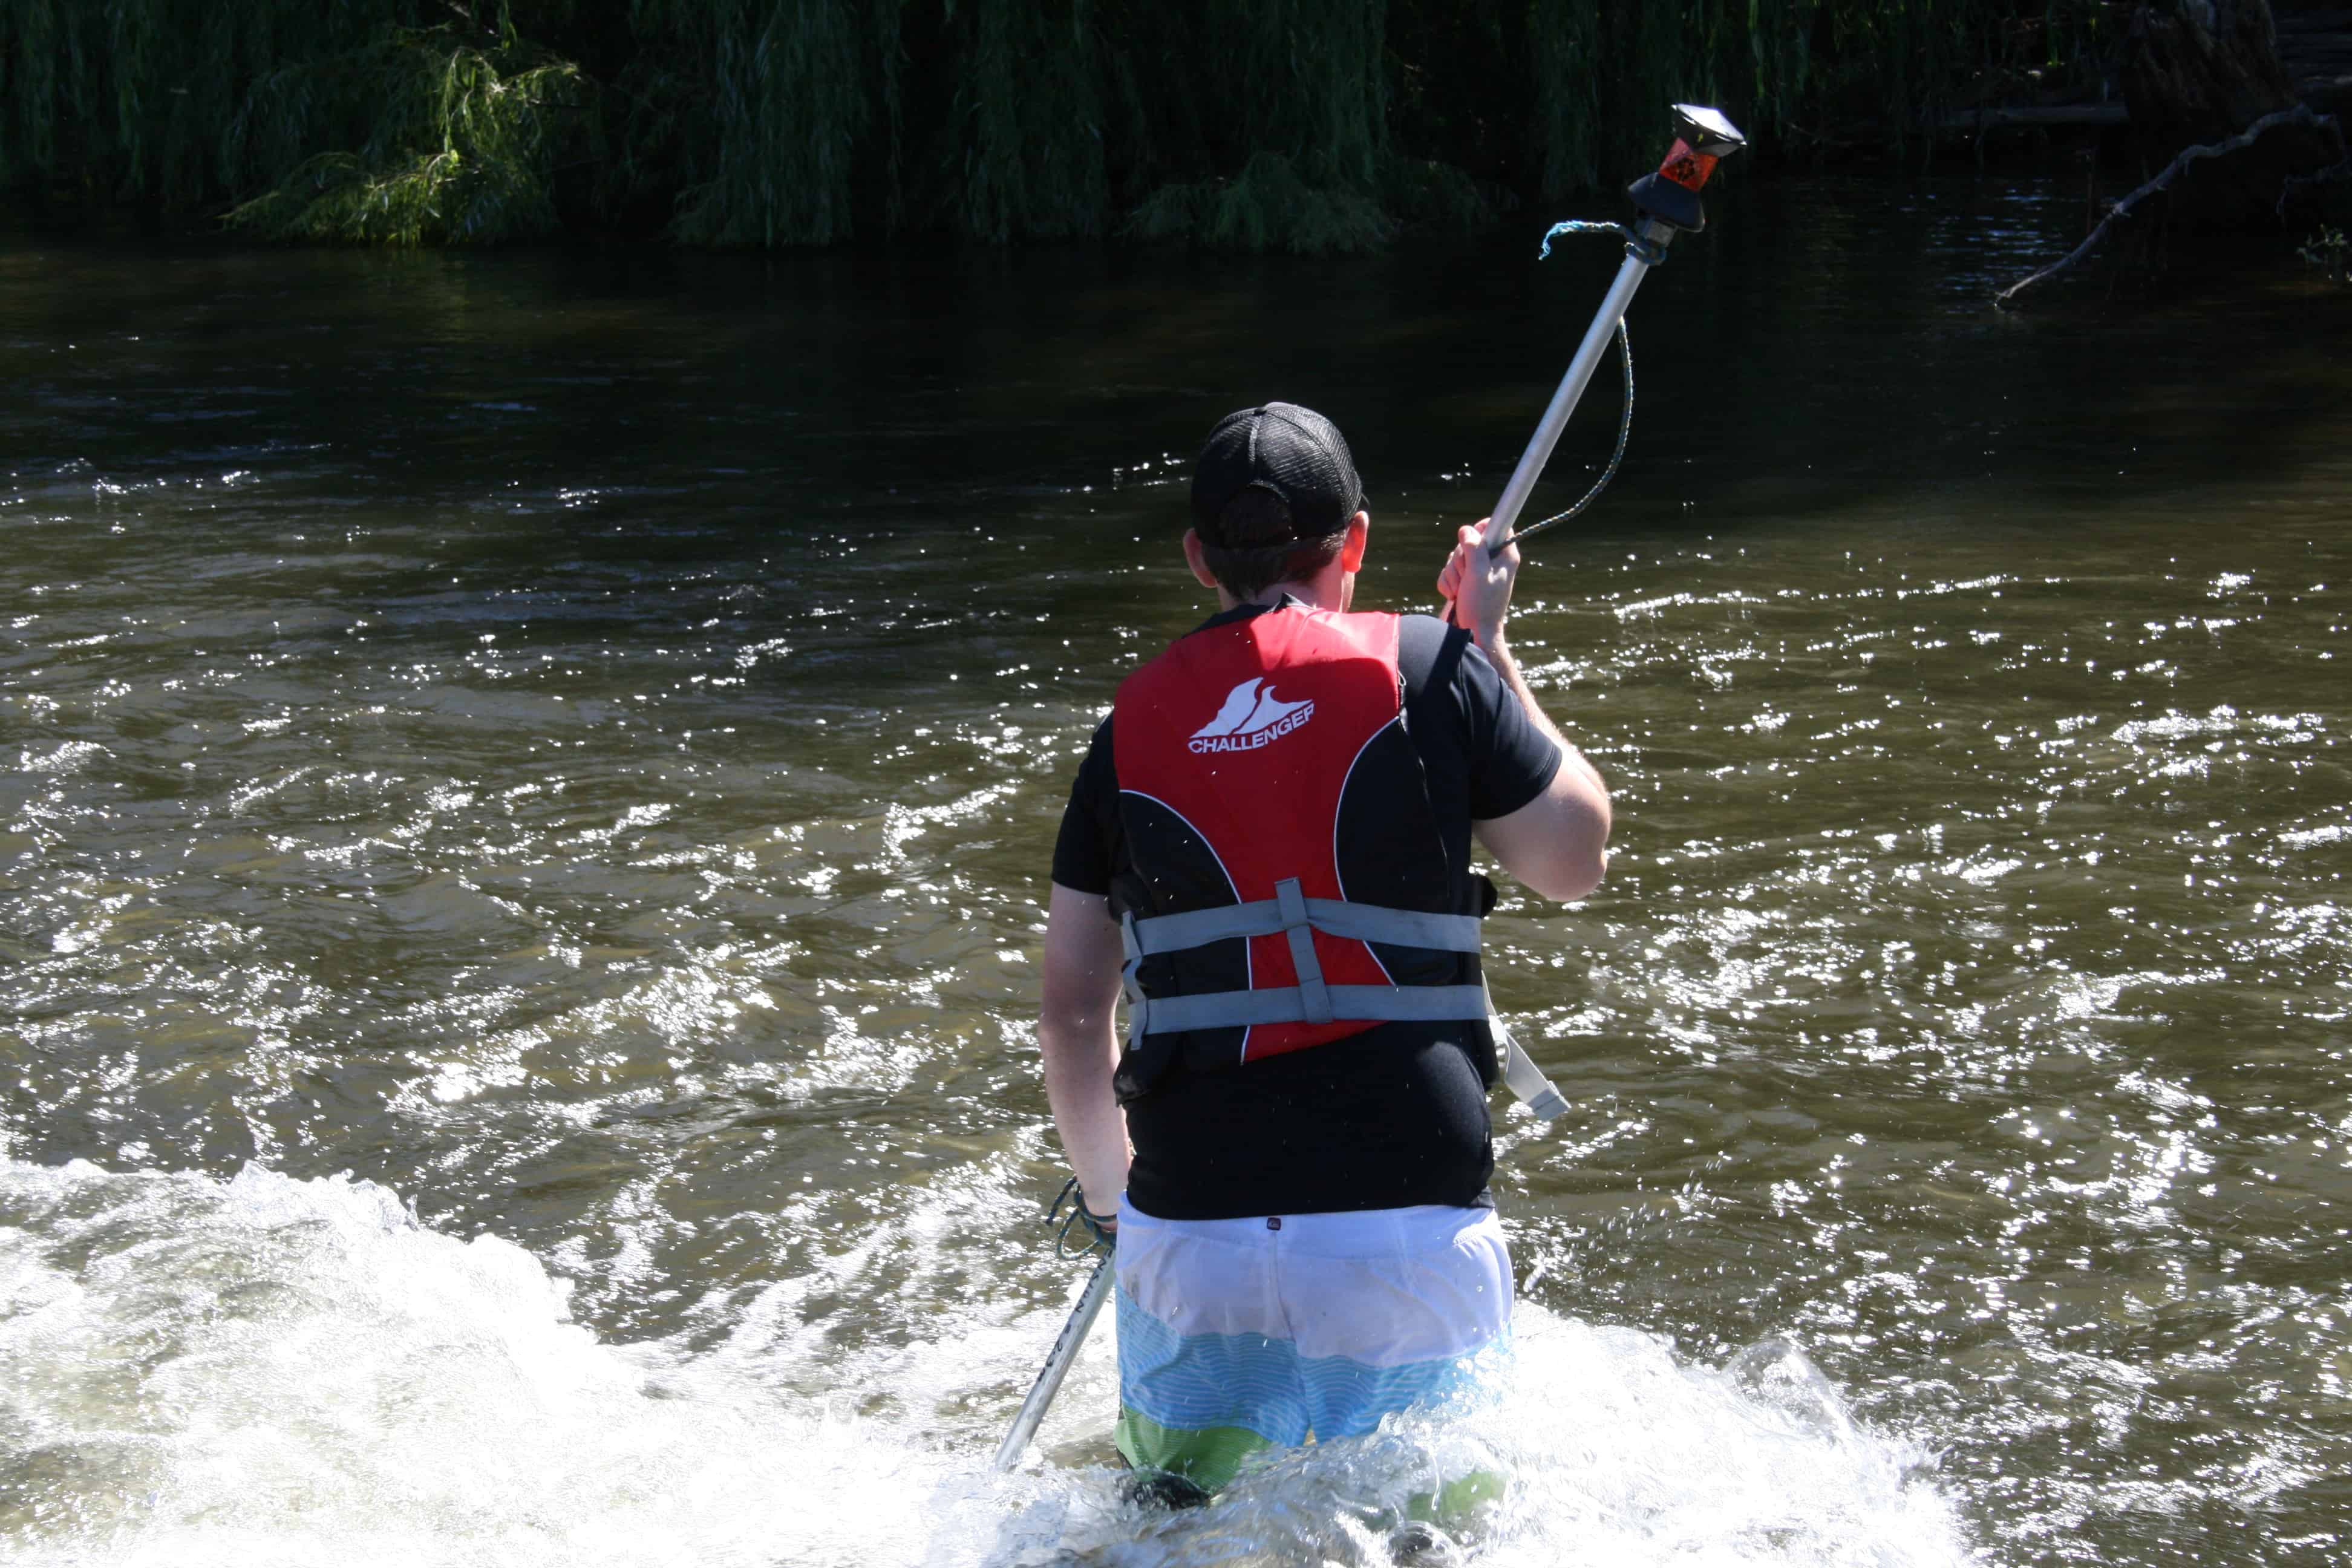
Jesse Schweida measuring the bed of the Macquarie River, January 2015
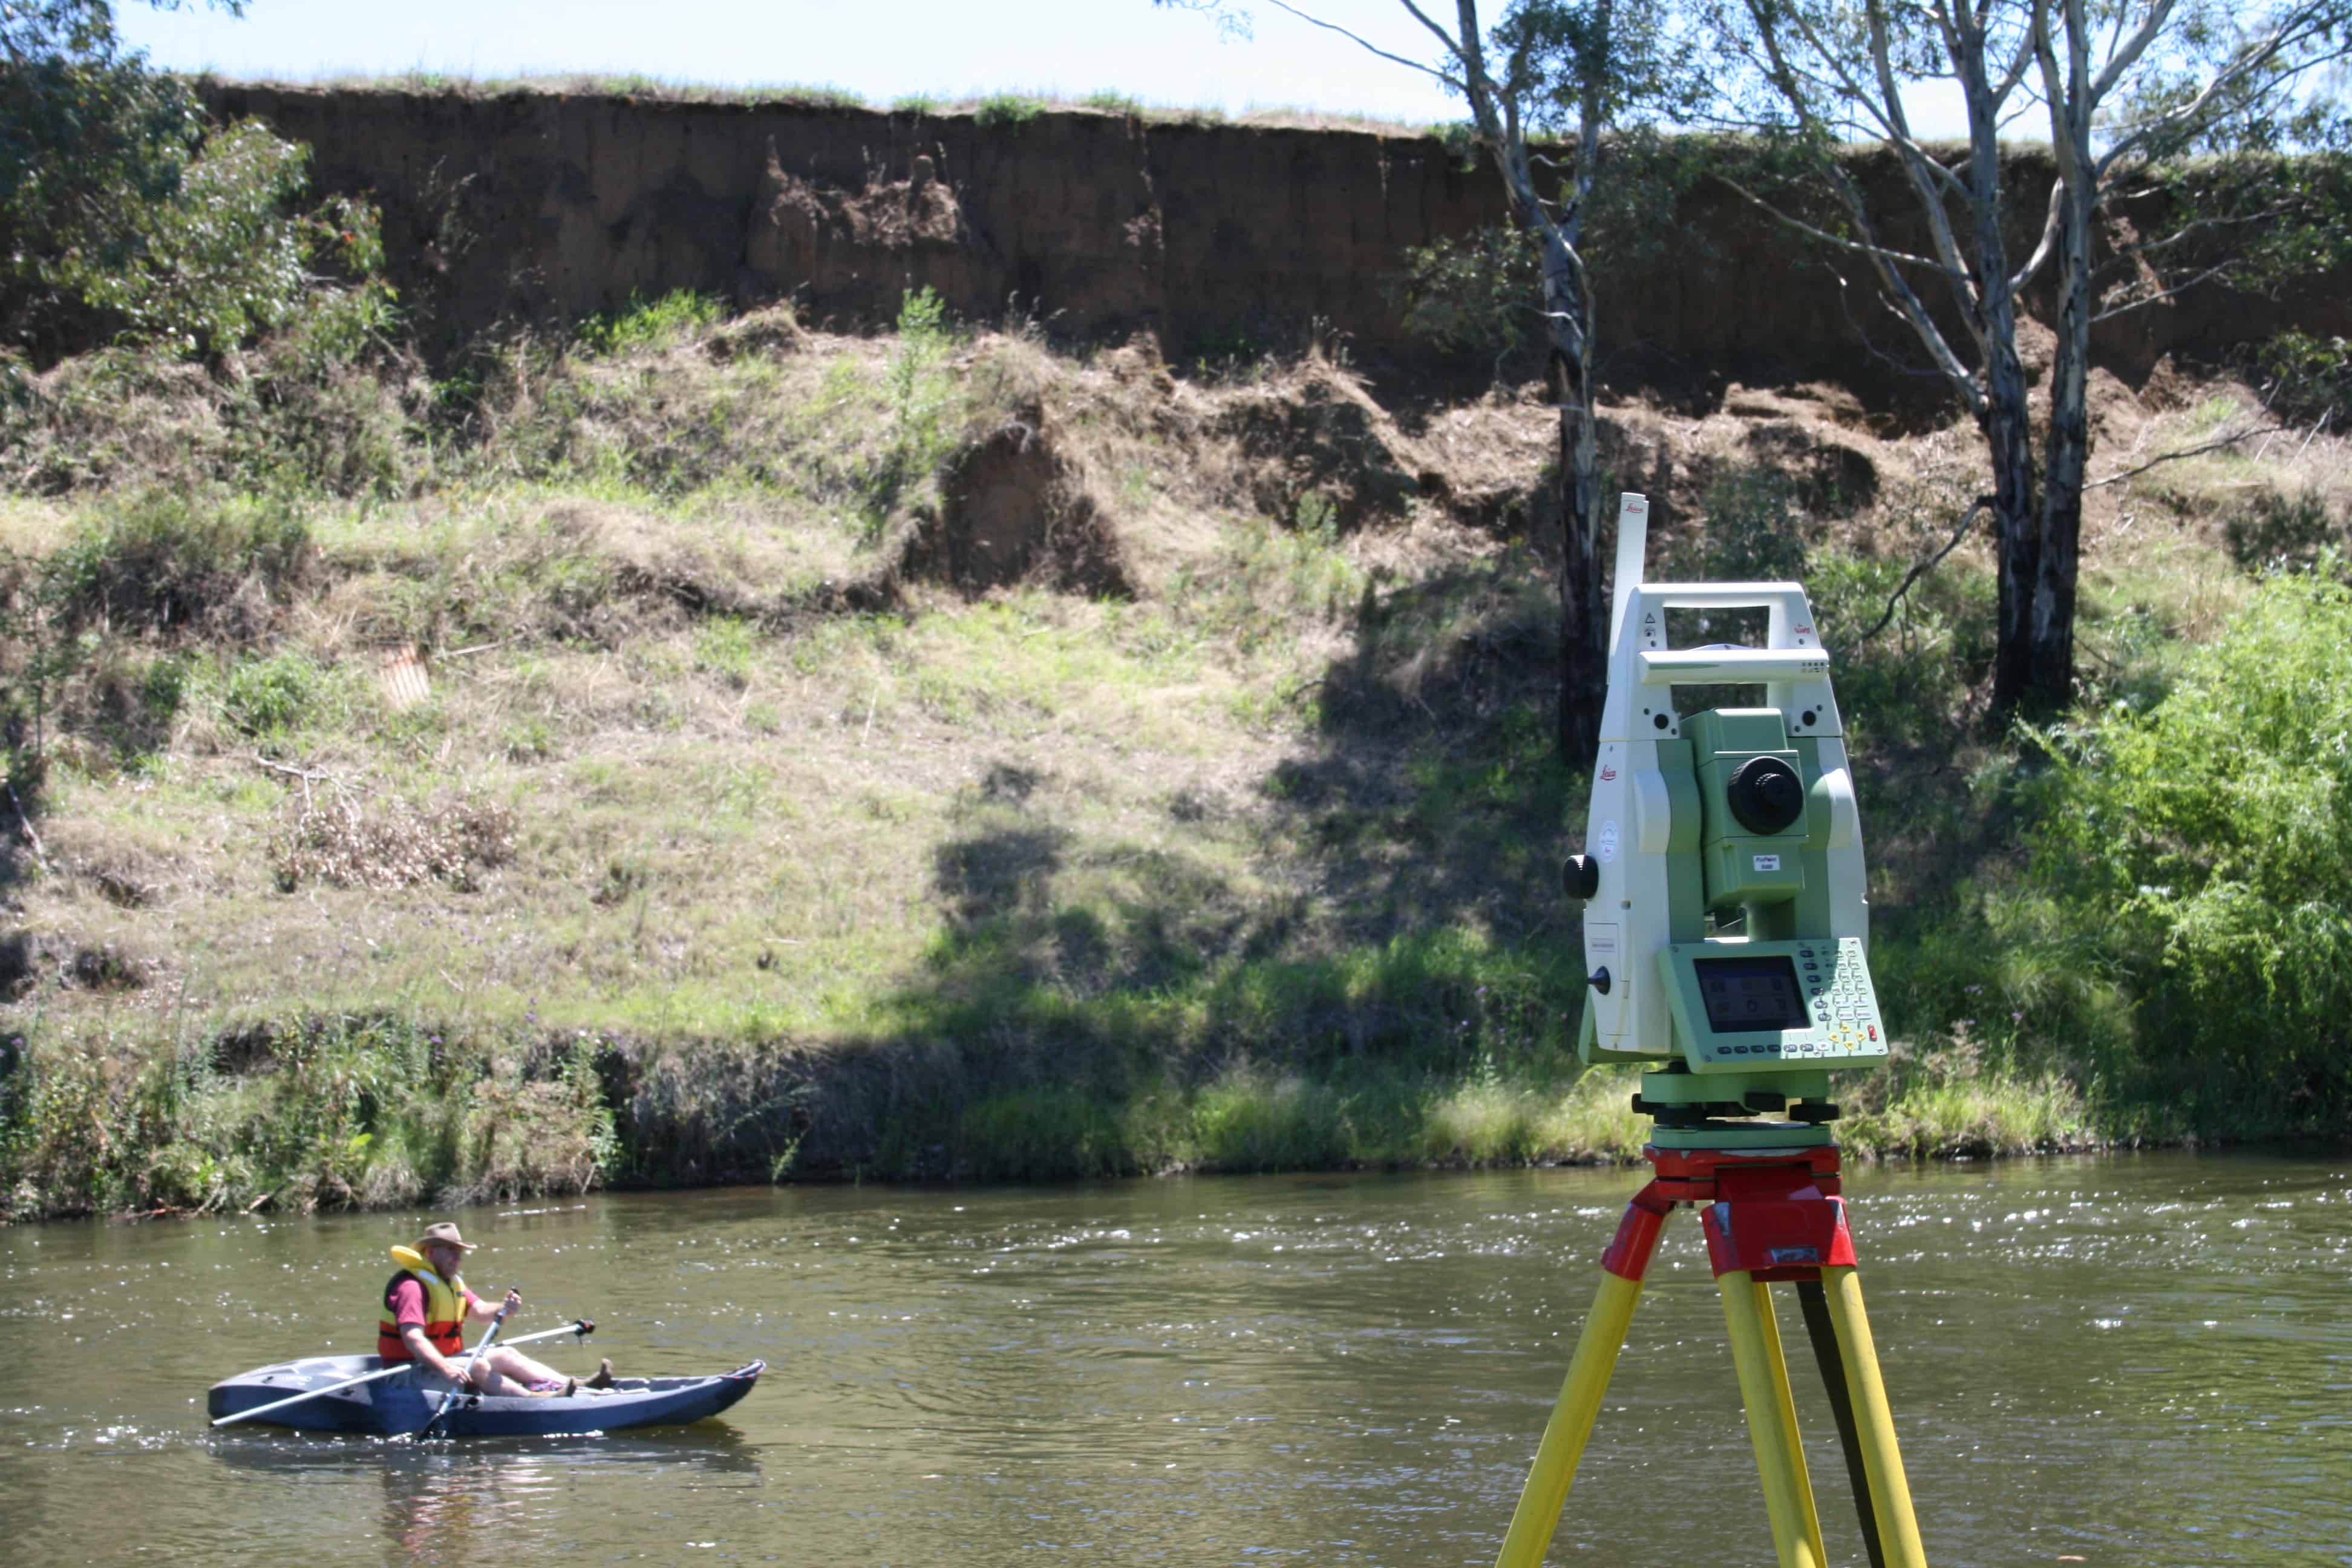
Surveyor Eric Smith measuring the bed of the Macquarie River by kayak, January 2015
Jesse Schweida measuring the bed of the Macquarie River, January 2015
The ground survey data was combined with the LiDAR data to generate a digital terrain model of the site, including the river bed.
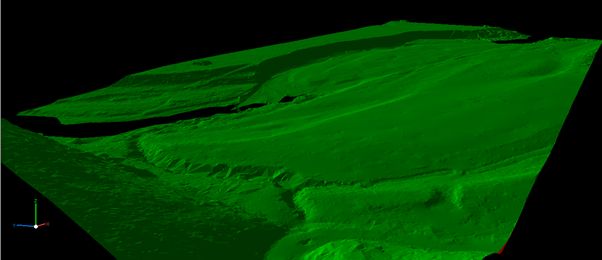
Oblique view of digital terrain model generated from combined LiDAR and ground survey data.
Rehabilitation
Geomorphologist Brad Davies will use this data to design rehabilitation structures. Groynes allow water to flow through and are typically constructed or naturally formed from fallen trees.
Groyne design, Diagrams from Design guideline for the reintroduction of wood into Australian Streams Dr Andrew P. Brooks
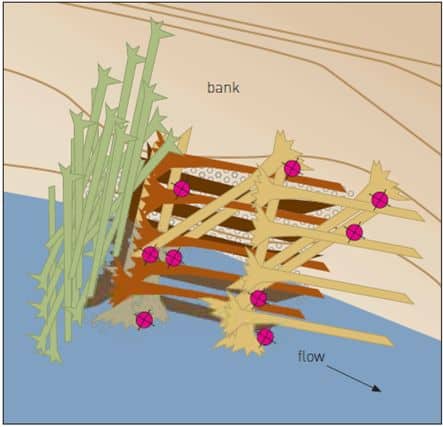
Groyne design, Diagrams from Design guideline for the reintroduction of wood into Australian Streams Dr Andrew P. Brooks
There are existing groynes on site, being trees fallen from the bank.
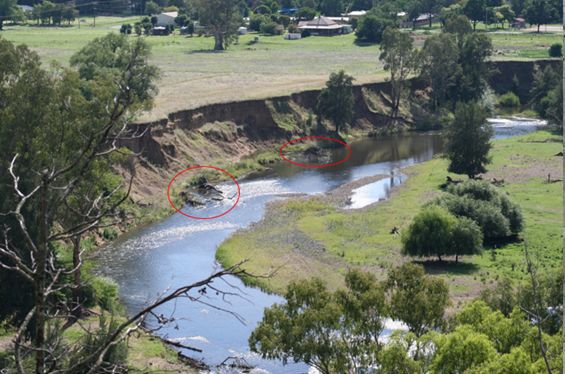
Existing groynes on site
In the future, it is planned that rehabilitation structures will be installed on site. Doherty Smith & Associates will continue to monitor the changes to the river and will assist with setting out works. Steps are being taken to involve higher levels of State Government to oversee the works and coordinate the multiple departments and other organisations with a stake in the project. Why does this site matter? Don’t all rivers change? Changes to rivers are expected, and are generally accepted as being slow and imperceptible. The changes to the river bank at this site are not slow or imperceptible. The land owner has already lost over 6 hectares of his land – at what point do we say “that’s enough”? Surely, the loss of over 6 hectares of land, at a linear rate of 1 metre per year, must be categorised as a serious and unnatural change. We hope to see action on this project in the near future!
Doherty Smith & Associates are hoping to assist in preventing the erosion on site from becoming worse.